java利用POI在word中绘制折线图
1.poi的简介
Apache POI 简介是用Java编写的免费开源的跨平台的 Java API,Apache POI提供API给Java程式对Microsoft Office(Excel、WORD、PowerPoint、Visio等)格式档案读和写的功能。
官方主页: http://poi.apache.org/index.html
API文档: http://poi.apache.org/apidocs/index.html
2.导包
<dependency>
            <groupId>org.apache.poigroupId>
            <artifactId>poiartifactId>
            <version>4.1.2version>
        dependency>
        <dependency>
            <groupId>org.apache.poigroupId>
            <artifactId>poi-ooxmlartifactId>
            <version>4.1.2version>
        dependency>
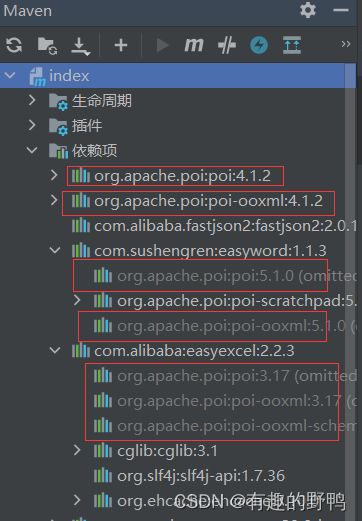
此处导包推荐4.1.2及以上,由于项目中还使用了easyword,easyexcel,spire.doc等在poi上扩展的包,他们中都含有poi的包。因此我把这个包放在了最前面可以防止报错与冲突。可以看到下图除4.1.2版本外,还有其他各种版本,如果将此版本放在后面,会出错无法成功显示(但不会报错,这种错误极其难排查)。

3.核心代码与操作
3.1绘制折线图的核心方法
此方法不需要改,只需要输入参数即可。第一个参数是图表,第二个参数是线的名称,第三个是x轴,第四个是y轴,最后一个是图表的名称
//折线图的生成
    public static void drawLineChart(XWPFChart chart, String[] series, String[] categories,
                                     List<Number[]> values, String chartTitle){
        final List<XDDFChartData> data = chart.getChartSeries();

        final XDDFLineChartData line = (XDDFLineChartData) data.get(0);//这里一般获取第一个,我们这里是折线图就是XDDFLineChartData

        final int numOfPoints = categories.length;

        final String categoryDataRange = chart.formatRange(new CellRangeAddress(1, numOfPoints, 0, 0));

        final XDDFDataSource<?> categoriesData = XDDFDataSourcesFactory.fromArray(categories, categoryDataRange, 0);
        for (int i = 0; i < values.size(); i++) {
            final String valuesDataRange = chart.formatRange(new CellRangeAddress(1, numOfPoints, i + 1, i + 1));
            Number[] value = values.get(i);
            final XDDFNumericalDataSource<? extends Number> valuesData = XDDFDataSourcesFactory.fromArray(value, valuesDataRange, i + 1);
            XDDFChartData.Series ser;//图表中的系列
            ser = line.getSeries().get(i);
            ser.replaceData(categoriesData, valuesData);
            CellReference cellReference = chart.setSheetTitle(series[i], 1);//修改系列标题
            ser.setTitle(series[i], cellReference);
        }

        chart.plot(line);
        chart.setTitleText(chartTitle);//折线图标题
        chart.setTitleOverlay(false);
    }
3.2 模板的设置
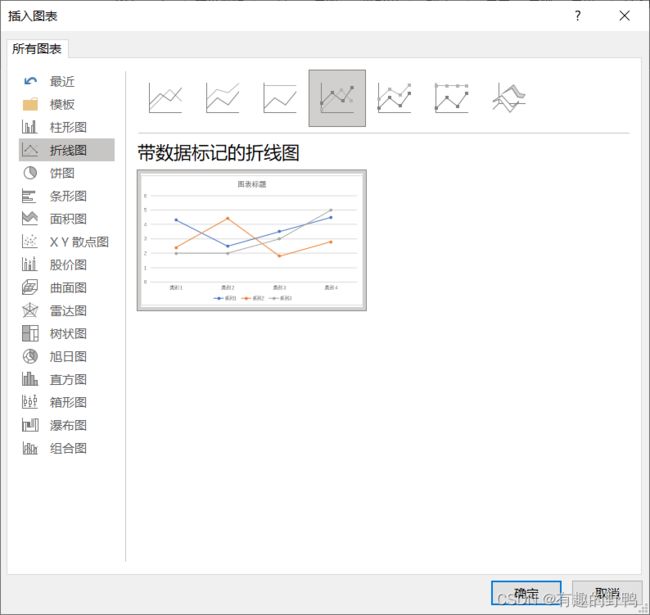
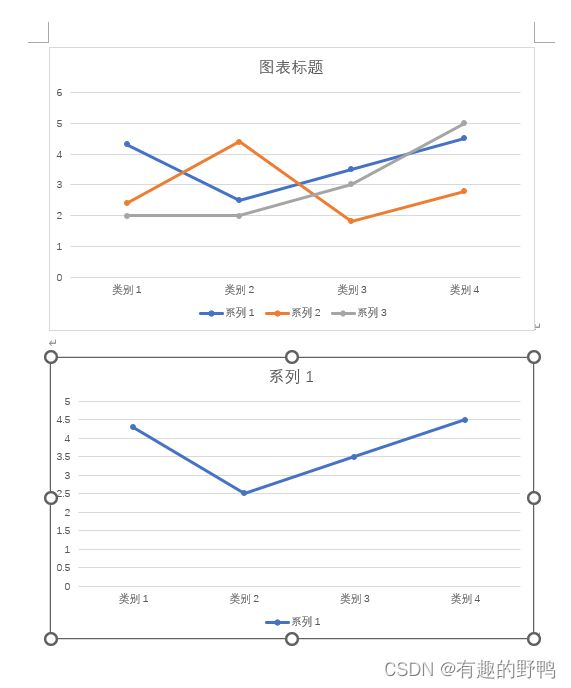
需要在word中打开设置模板。插入选择图表。选择图表。

图表中选择折线图

本处测试2条折线图

public class main {
    @Test
    public void printChart(){
        String templatePath = "src/main/resources/static/test.docx";
        XWPFDocument doc=null;
        try{
            InputStream is = new FileInputStream(new File(templatePath));
            doc = new XWPFDocument(is);
        }
        catch (Exception e){
            System.out.println(e);
        }
        String[] series1 = {"测试折线1","测试折线2","测试折线3"};//每条线的名称
        String[] series2 = {"测试折线"};//

        String title1="测试折线图1";
        String title2="测试折线图2";

        //y轴
        List<Number[]> value1 = new ArrayList<>();//每一条折现图,第一个表3条,需要和图中条数一样
        List<Number[]> value2 = new ArrayList<>();//每一条折现图,第二个表1条
        //第一张图的y轴
        Number[] n1={1,2,3,5};
        Number[] n2={4,2,1,4};
        Number[] n3={5.8,6.2,1,0.2};
        value1.add(n1);
        value1.add(n2);
        value1.add(n3);
        //第二张图的y轴
        Number[] n={0.3,-5.4,2.0,-1.2};
        value2.add(n);
        //x轴
        String[] x1={"1","2","3","4"};
        String[] x2={"a","b","c","d"};

        XWPFChart xChart1 = doc.getCharts().get(0);//获取第1个图表
        XWPFChart xChart2 = doc.getCharts().get(1);//获取第2个图表

        drawLineChart(xChart1,series1,x1,value1,title1);
        drawLineChart(xChart2,series2,x2,value2,title2);


        try (FileOutputStream fos = new FileOutputStream(templatePath)) {
            doc.write(fos);
        } catch (FileNotFoundException e) {
            e.printStackTrace();
        } catch (IOException e) {
            e.printStackTrace();
        }


    }

}
