Python爬取、存储、分析、可视化豆瓣电影Top250
Python爬取、存储、分析、可视化豆瓣电影Top250
网站链接:
https://movie.douban.com/top250
@文章目录
前言
一、python爬取目标数据,并写入csv文件
二、pymysql数据存储
三、pandas数据清洗、处理
四、pandas、pyecharts、matplotlib数据可视化
五、自我陈述
前言
在Python的基础上爬取豆瓣电影Top250的数据信息(老师的案例作业)
主要知识点:Python、pymysql、pandas、pyecharts、matplotlib
主要运用工具:pycharm、navicate、jupyter
提示:以下是本篇文章正文内容,下面案例可供参考
一、Python爬取目标数据,并写入csv
运用了requests库获取页面、BeautifulSoup库解析页面(方法很多,可自行延伸)、
1、引入库
import requests
from bs4 import BeautifulSoup
import csv
import re
2、获取一级页面内容
用"get_one_page()"作为函数,别忘了添加"headers"做反爬
特别注意:
“cookie"值要用自己注册的豆瓣账号登陆后的页面获取的"cookie”
def get_one_page(url):
    headDict = {
    加入自己的“user_agent:”、“accept“、”cookie“
    }

    r = requests.get(url,headers = headDict)
    r.encoding = r.apparent_encoding
    html = r.text
    return html
3、解析获取的页面
解析页面时,我爬取的是:
电影排名、片名、评分、评价人数、电影类型、制片国家、上映时间、电影时长
在一级页面爬取了制片国家(二级也可以爬取),其他指标都在二级爬取
运用了find、select,也可以用xpath、re
def parse_one_page(html):
    soup = BeautifulSoup(html,'lxml')
    movie = soup.find("ol",class_='grid_view')
    erjilianjie = movie.find_all('li')

	 for lianjie in erjilianjie:
        #一级页面制片国家
        others = lianjie.find('div', class_='bd').find('p').text.strip('').split('\n')
        year_country = others[2].strip('').split('\xa0/\xa0')
        pro_country = year_country[1].replace(' ',',')

        #链接
        a = lianjie.find('a')
        erji = a['href']
        html = get_one_page(erji)

        soup = BeautifulSoup(html,'lxml')
        #排名
        ranks = soup.select('#content > div.top250 > span.top250-no')[0].getText().strip()
        #片名
        spans = soup.select('h1 span')
        movie_name1 = spans[0].get_text()
        movie_name  = movie_name1.split(' ')[0]
        # print(movie_name)
        #评分
        score = soup.select('#interest_sectl > div.rating_wrap.clearbox > div.rating_self.clearfix > strong')[0].getText().strip()
        #评价人数
        sorce_people = soup.select('#interest_sectl > div.rating_wrap.clearbox > div.rating_self.clearfix > div > div.rating_sum > a > span')[0].getText().strip()
        #info板块
        info = soup.find('div',id='info')
        #电影类型
        movie_type = ''
        movie_types = info.find_all('span',property='v:genre')
        for i in movie_types:
            movie_type = movie_type + ',' + i.string
            movie_type = movie_type.lstrip(',')
        #二级页面制片国家
        # pro_country = re.findall("制片国家/地区:(.*)
",str(info))
        # pro_country = ','.join(pro_country)
        # print(pro_country)
        #上映日期
        up_time = ''
        up_times = info.find_all('span',property='v:initialReleaseDate')
        for i in up_times:
            up_time = up_time + "," + i.string
            up_time = up_time.lstrip(',')
        #电影时长
        movie_time = ''
        movie_times = info.find_all('span',property='v:runtime')
        for i in movie_times:
            movie_time = movie_time + i.string

#将数据写入data,做迭代器储存数据
        data = {
            'id':ranks,
            'name':movie_name,
            'score':score,
            'votes':sorce_people,
            'country':pro_country,
            'type':movie_type,
            'date':up_time,
            'runtime':movie_time,
            'link':erji
        }
        yield data
4、写入csv文件
def write_to_file(content):
    file_name = 'movie.csv'
    with open(file_name,'a',newline='',encoding='utf-8') as f:
        writer = csv.writer(f)
        for i in content:
            writer.writerow(i.values())
5、调用主函数
特别注意:
一定要调用函数,调试时,只用一页来调试,多页会反爬
if __name__ == "__main__":
    for i in range(10):
        urls = 'https://movie.douban.com/top250?start='+str(i*25)+'&filter='
        html = get_one_page(urls)
        parse_one_page(html)
        content = parse_one_page(html)
        write_to_file(content)
        print("写入第"+str(i)+"页数据成功")


    # # 调试函数
    # url = 'https://movie.douban.com/top250'
    # html = get_one_page(url)
    # parse_one_page(html)
    # content = parse_one_page(html)
二、pymysql数据存储
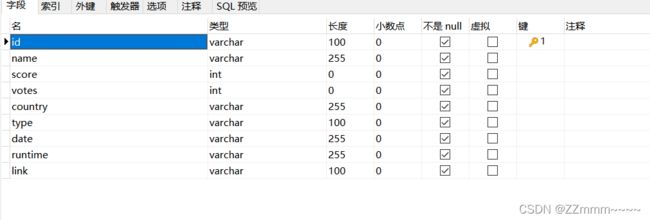
1.在navicate中创建movie表
2、将movie.csv里的数据传入movie表
特别注意:
"db"是数据库名称,用自己navicate里的host、user、password
import pymysql
import csv


def write_to_table():
    #连接MYSQL数据库(注意:charset参数是utf8m64而不是utf-8)
    db = pymysql.connect(host = "localhost",
                         user = 'root',
                         password = 'root',
                         db = "movie",
                         charset = "utf8m64",)
    #创建对象
    cursor = db.cursor()

    #读取csv文件
    with open('movie.csv','r',encoding='utf-8') as f:
        read = csv.reader(f)
        for each in list(read):
            i = tuple(each)
            # print(i)
            #SQL语句添加数据
            sql = "INSERT INTO movie VALUES" + str(i)
            #执行SQL语句
            cursor.execute(sql)
        # 提交数据
        db.commit()
        # #关闭游标
        cursor.close()
        # #关闭数据库
        db.close()

if __name__ == '__main__':
    write_to_table()
三、pandas数据清洗、处理
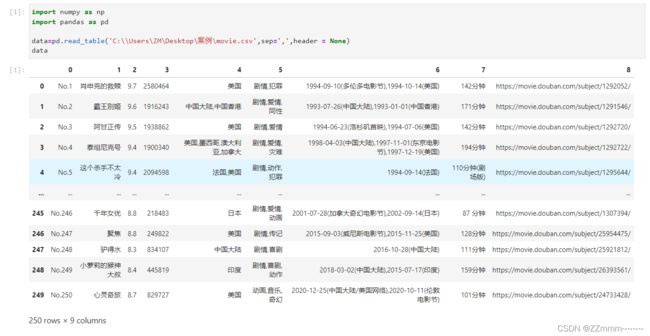
1、jupyter读取movie.csv中数据并处理
import numpy as np
import pandas as pd

#如果没有header = None,会自动将第一行设置为表头哦
data=pd.read_table('movie.csv',sep=',',header = None)
data
2、查看是否有缺失值数据
data.isnull().any()#查看是否有缺失值数据
3、查看是否有重复值
data.duplicated().sum()#查看是否有重复值数据
如图:
4、添加表头
data.columns = ['排名','片名','评分','评价人数','制片国家',
                  '类型','上映日期','时长','影片链接']
data
5、保存处理好的数据到movie1.csv
data.to_csv('movie1.csv')
四、pandas、pyecharts、matplotlib数据可视化
1、读取movie1.csv文件数据
import pandas as pd
data = pd.read_csv('movie1.csv')
data
2、绘制电影评价人数前十名(柱状图)
from pyecharts import options as opts
from pyecharts.charts import Bar


df = data.sort_values(by='评价人数', ascending=True)
bar = (
        Bar()
        .add_xaxis(df['片名'].values.tolist()[-10:])
        .add_yaxis('评价人数', df['评价人数'].values.tolist()[-10:])
        .set_global_opts(
            title_opts=opts.TitleOpts(title='电影评价人数'),
            yaxis_opts=opts.AxisOpts(name='人数'),
            xaxis_opts=opts.AxisOpts(name='片名'),
            datazoom_opts=opts.DataZoomOpts(type_='inside'),
            )
        .set_series_opts(label_opts=opts.LabelOpts(position="top"))
        .render('电影评价人数前十名.html')
        )
bar
3、绘制各地区电影上映数量Top10(柱状图-横向)
特别注意:
制片国家里有几个国家一起的情况,要先用" “代替”,“,用” "分割,再用count计算每个国家的数量
country_all = data['制片国家'].str.replace(","," ").str.split(" ",expand=True)
country_all = country_all.apply(pd.value_counts).fillna(0).astype("int")
country_all['count']= country_all.apply(lambda x:x.sum(),axis=1)
country_all.sort_values('count',ascending=False)
data1=country_all['count'].sort_values(ascending=False).head(10)
country_counts = data1
country_counts.columns = ['制片国家', '数量']
country_counts = country_counts.sort_values(ascending=True)
from pyecharts.charts import Bar
bar = (
        Bar()
        .add_xaxis(list(country_counts.index)[-10:])
        .add_yaxis('地区上映数量', country_counts.values.tolist()[-10:])
        .reversal_axis()
        .set_global_opts(
        title_opts=opts.TitleOpts(title='地区上映电影数量'),
        yaxis_opts=opts.AxisOpts(name='国家'),
        xaxis_opts=opts.AxisOpts(name='上映数量'),
        )
        .set_series_opts(label_opts=opts.LabelOpts(position="right"))
        .render('各地区上映电影数量前十.html')
        )
bar
4、绘制电影时长分布直方图
特别注意:
爬取的数据中,时长列并非纯数字,需要将多余的字符删除后,只保留第一个电影时长数据,再做计算
movie_duration_split = data['时长'].str.replace("\', \'","~").str.split("~",expand=True).fillna(0)
movie_duration_split =movie_duration_split.replace(regex={'分钟.*': ''})
data['时长']=movie_duration_split[0].astype("int")
#data['时长'].head()
#查看最大时长
#data.时长.max()

import matplotlib.pyplot as plt
bins=[0,80,100,120,140,160,180,240]
pd.cut(data.时长,bins)
pd.cut(data.时长,bins).value_counts()
pd.cut(data.时长,bins).value_counts().plot.bar(rot=20)
五、自我陈述
代码的逻辑很多,本人初学者,还需多学习,不喜勿喷
如有需要,自取代码


