R语言 tidyverse系列学习笔记(系列4)PlantGrowth - percentage table
本篇学习数据分析, Excel 表格制作
Task: 创建一个 行 百分比 表格
row percentage table
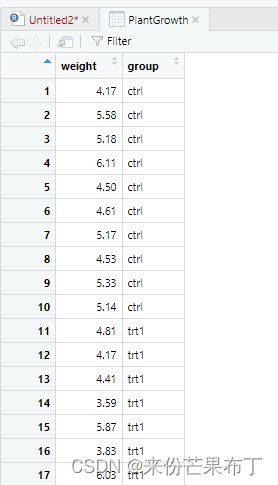
先看一下 PlantGrowth 数据集
library(dplyr)

data("PlantGrowth")
view(PlantGrowth)
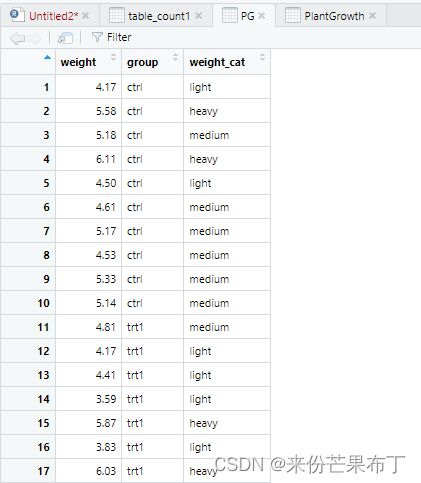
给数据集新加一列 weight_cat ,并用 case_when 自定义名称
PG = PlantGrowth |>
  mutate(weight_cat = case_when(
    weight <= 4.5 ~ "light",
    weight > 4.5 & weight <= 5.5 ~ "medium",
    weight > 5.5 ~ "heavy"
      )
         )

view(PG)
统计 group 和 weight_cat 的次数
table(PG$group, PG$weight_cat)

table_count1 = table(PG$group,PG$weight_cat)
view(table_count1)
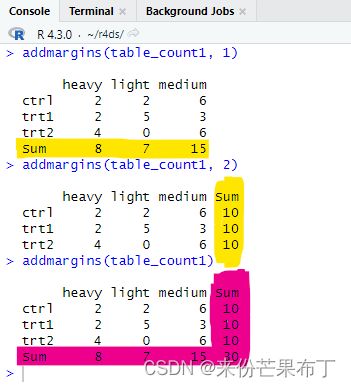
addmargins
addmargins(table_count1, 1) # 在最后一行加
addmargins(table_count1, 2) # 在最后一列加
addmargins(table_count1) # 在最后一行和最后一列都加
创建 行 百分比 表格
即每行加起来为100%,但每列加起来不一定是100%
# row percentage table
table_count2 = addmargins(table_count1, 1)
table_count2
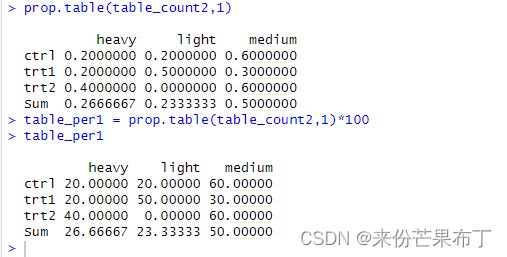
proportion 比例
prop.table(x,1) 按行计算百分比
prop.table(x,2) 按列计算百分比
最后一列加sum
table_count3 = addmargins(table_count2,2)
table_count3

table_per2 = addmargins(table_per1,2)
table_per2
可以看到每行 sum 都是100
paste0

如果直接把 count 和 percentage 拼接起来,结果有点奇怪,可以根据需求自定义修改

paste0(table_count3, "(", round(table_per2), "%)")
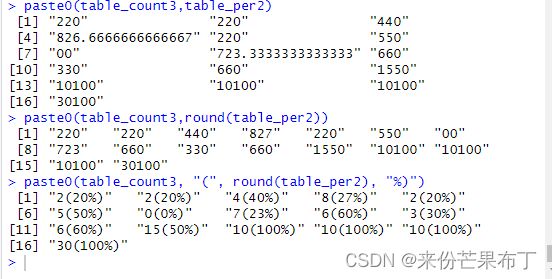
先用round去掉了小数点,再把百分比数值前边加上(,再把百分比数值右边加上%和)
matrix
matrix(paste0(table_count3, "(", round(table_per2), "%)"),dim(table_count3))
将输出变成矩阵的形式,可以指定输出的 shape,用dimention来指定shape更方便
数据有了,我们还缺少行名和列名,下面介绍一个快捷方式
dimnames
先看例子
dimnames(table_count3)
先输出行名,在输出列名
加到我们需要的表格上
matrix(paste0(table_count3, "(", round(table_per2), "%)"),dim(table_count3),dimnames = dimnames(table_count3))

以上,我们就得到了需要的表格,现在将最后一条代码规整化并命名新的表名
tab_combine = matrix(paste0(table_count3, "(", round(table_per2), "%)"),
                     dim(table_count3),
                     dimnames = dimnames(table_count3)
                     )
完整代码
library(dplyr)

data("PlantGrowth")
view(PlantGrowth)

PG = PlantGrowth |>
  mutate(weight_cat = case_when(
    weight <= 4.5 ~ "light",
    weight > 4.5 & weight <= 5.5 ~ "medium",
    weight > 5.5 ~ "heavy"
      )
         )

view(PG)


table_count1 = table(PG$group,PG$weight_cat)
table_count2 = addmargins(table_count1, 1)

table_per1 = prop.table(table_count2,1)*100
table_count3 = addmargins(table_count2,2)
table_per2 = addmargins(table_per1,2)

tab_combine = matrix(paste0(table_count3, "(", round(table_per2), "%)"),
                     dim(table_count3),
                     dimnames = dimnames(table_count3)
                     )
拓展任务:column percentage table & overall percentage table
column percentage table
tab_1 = table(PG$group,PG$weight_cat)
tab_2 = addmargins(tab_1,2)
tab_3 = addmargins(tab_2,1)

tab_per1 = prop.table(tab_2,2)*100
tab_per2 = addmargins(tab_per1,1)

tab_colmn_combine = matrix(paste0(tab_3, "(", round(tab_per2), "%)"),
                           dim(tab_3),
                           dimnames = dimnames(tab_3)
                           )

tab_colmn_combine
overall percentage table
tab_1 = table(PG$group,PG$weight_cat)
tab_2 = addmargins(tab_1)


tab_per1 = prop.table(tab_1)*100
tab_per2 = addmargins(tab_per1)

tab_colmn_combine = matrix(paste0(tab_2, "(", round(tab_per2), "%)"),
                           dim(tab_2),
                           dimnames = dimnames(tab_2)
)

tab_colmn_combine

