Echarts-折线图-设置线条颜色以及线条以下区域显示渐变颜色
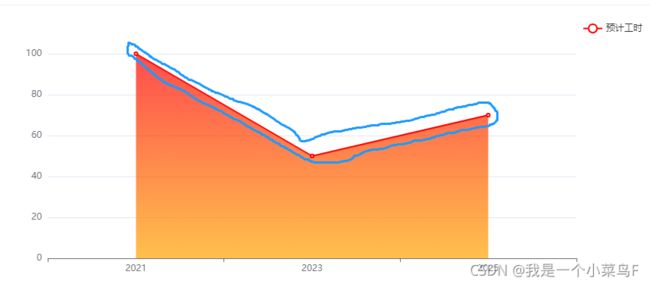
首先,先看折线图效果。
1.设置线条颜色:
在series中,数组项设置lineStyle属性。
  lineStyle: { // 设置线条的style等
              normal: {
              color: 'red', // 折线线条颜色:红色
             },
           },
2.设置线条上点的颜色(也是图例的颜色)
在series中,使用itemStyle属性。
              itemStyle: {
                // 设置线条上点的颜色(和图例的颜色)
                normal: {
                  color: 'red',
                },
              },
3.设置线条下,渐变颜色设置
在series中,使用areaStyle属性。
              areaStyle: {
                color: {
                  type: 'linear',
                  x: 0,
                  y: 0,
                  x2: 0,
                  y2: 1,
                  colorStops: [  // 渐变颜色
                    {
                      offset: 0,
                      color: 'red',
                    },
                    {
                      offset: 1,
                      color: 'Orange',
                    },
                  ],
                  global: false,
                },
              },
上述是一些小点,以下是完整代码。
  const showCodesChart = () => {

    const chartDom = document.getElementById('burnedChart'); // 自己定义的容器id
    if (chartDom) {
      // 基于准备好的dom,初始化echarts实例
      const myChart = echarts.init(chartDom);
      // 绘制图表
      myChart.setOption({

        tooltip: {
          trigger: 'axis',
        },
        legend: {
          orient: 'vertical',
          data: ['预计工时'],
          right: -5,
          top: 15,
        },
        xAxis: {
          type: 'category',
          data: ['2021', '2023', '2025'] // 时间

        },
        yAxis: {
          type: 'value',
        },
        series: [
          {
            name: '预计工时',
            type: 'line',
            data: [100, 50, 70],
            lineStyle: {// 设置线条的style等
              normal: {
                color: 'red', // 折线线条颜色:红色
              },
            },
            itemStyle: {
              // 设置线条上点的颜色(和图例的颜色)
              normal: {
                color: 'red',
              },
            },
            areaStyle: {
              color: {
                type: 'linear',
                x: 0,
                y: 0,
                x2: 0,
                y2: 1,
                colorStops: [  // 渐变颜色
                  {
                    offset: 0,
                    color: 'red',
                  },
                  {
                    offset: 1,
                    color: 'Orange',
                  },
                ],
                global: false,
              },
            },
          },
        ],
      });

    }

  };


