十四、应用监控(1)
本章概要
- 监控端点配置(开启端点,暴露端点,端点保护,端点响应缓存,路径映射,CORS支持,健康信息,应用信息)
当一个Spring Boot 项目运行时,开发者需要对 Spring Boot 项目进行实时监控,获取项目的运行情况,在项目出错时能够实现自动预警等。
Spring Boot 提供了 actuator 来帮助开发者获取应用程序的实时运行数据,开发者可以选择使用 HTTP 端点或 JMX 来管理和监控应用程序,包括健康情况、应用信息、内存使用情况等。
14.1 端点配置
14.1.1 开启端点
添加 spring-boot-starter-actuator 依赖,actuator (执行器)是制造业术语,指一个用于移动或控制机械装置的工具,一个很小的变化就能让执行器产生大量的运动。
<dependency>
    <groupId>org.springframework.bootgroupId>
    <artifactId>spring-boot-starter-actuatorartifactId>
dependency>
开发者可以使用执行器中的端点(EndPoints)对应用进行监控或者与应用进行交互,Spring Boot 默认包含许多端点,如下
| 端点 | 端点描述 | 是否开启 |
|---|---|---|
| auditevents | 展示当前应用程序的审计信息 | Yes |
| beans | 展示所有SpringBeans信息 | Yes |
| conditions | 展示一个自动配置类的使用报告,该报告展示所有自动配置类及他们被使用或未使用的原因 | Yes |
| configprops | 展示所有@configurationProperties的列表 | Yes |
| env | 展示系统运行信息 | Yes |
| flyway | 展示数据库迁移路径 | Yes |
| health | 展示应用程序的健康信息 | Yes |
| httptrace | 展示trace信息,(默认为最新的100条HTTP请求) | Yes |
| info | 展示应用的定制信息,这些定制信息以info开头 | Yes |
| loggers | 展示并修改应用的日志配置 | Yes |
| liquibase | 展示任何Liquibase数据库迁移路径 | Yes |
| metrice | 展示应用程序度量信息 | Yes |
| mappings | 展示所有@RequestMapping路径的集合列表 | Yes |
| scheduledtasks | 展示应用的所有定时任务 | Yes |
| shutdown | 远程关闭应用接口 | No |
| sessions | 展示并操作spring session回话 | Yes |
| threaddump | 展示线程活动的快照 | Yes |
如果是一个 Web 应用,还会有以下端点
| 端点 | 端点描述 | 是否开启 |
|---|---|---|
| headdump | 返回一个GZip压缩的hprof堆转储文件 | Yes |
| jolokia | 展示通过HTTP暴露的JMX beans | Yes |
| logfile | 返回日志文件的内容 | Yes |
| prometheus | 展示一个可以被Promentheus服务器抓取的metrics数据 | Yes |
这些端点大部分都是默认开启的,只有 shutdown 端点默认未开启,如果需要开启,可以在 application.properties 中通过如下配置开启。
management.endpoint.shutdown.enabled=true
如果开发者不想暴露这么多端点,那么可以关闭默认的配置,然后手动指定需要开启哪些端口,如下配置表示关闭所有端点,只开启 info 端点
management.endpoints.enabled-by-default=false
management.endpoint.info.enabled=true
14.2.2 暴露端点
由于有的端点包含敏感信息,因此端点启用和暴露是两码事,以下是端点默认暴露情况
| 端点 | JMX | Web |
|---|---|---|
| auditevents | Yes | NO |
| beans | Yes | NO |
| conditions | Yes | NO |
| configprops | Yes | NO |
| env | Yes | NO |
| flyway | Yes | NO |
| health | Yes | NO |
| httptrace | Yes | NO |
| info | Yes | Yes |
| loggers | Yes | NO |
| liquibase | Yes | NO |
| metrics | Yes | NO |
| mapping | Yes | NO |
| scheduledtasks | Yes | NO |
| shutdown | Yes | NO |
| sessions | Yes | NO |
| threaddump | Yes | NO |
| headdump | N/A | NO |
| jolokia | N/A | NO |
| logfile | N/A | NO |
| prometheus | N/A | NO |
在 Web 应用中,默认只有 health 和 info 两个端点暴露,即当开发者在 Spring Boot 项目中加入 spring-boot-starter-actuator 依赖并启动 Spring Boot 项目后,默认只有这两个端口可访问,启动日志如下

开发者可以在配置文件中自定义需要暴露哪些端点,例如要暴露 mapping 和 metrics 端点,添加如下配置即可
management.endpoints.web.exposure.include=mappings,metrics
如果要暴露所有端点,添加如下配置
management.endpoints.web.exposure.include=*
注意:由于 * 在 YML 配置文件用有特殊含义,需要用引号,如 “*”
当配置暴露所有端点后,启动日志如下:

并非所有的端点都在启动日志中展示出来,这是因为部分端点需要相关依赖才能使用,例如 session 端点需要 spring-session 依赖。对于已经展示出来的接口,开发者可以直接发送相应的请求查看相关信息。
例如请求 health 端点
14.1.3 端点保护
如果这些端点需要对外提供服务,那么最好能够将这些端点保护起来,若 classpath 中存在 Spring Security ,则默认使用 Spring Security 保护,如下,添加依赖
<dependency>
    <groupId>org.springframework.bootgroupId>
    <artifactId>spring-boot-starter-securityartifactId>
dependency>
然后添加 Spring Security 配置
@Configuration
public class ActuatorSecurity extends WebSecurityConfigurerAdapter {
    @Override
    protected void configure(HttpSecurity http) throws Exception {
        http.requestMatcher(EndpointRequest.toAnyEndpoint())
                .authorizeRequests()
                .anyRequest().hasRole("ADMIN")
                .and()
                .httpBasic();
    }
}
在 HttpSecurity 中配置所有的 Endpoint 都需要 ADMIN 角色才能访问,同时开启 HttpBasic 认证。
注意:EndpointRequest.toAnyEndpoint() 表示匹配所有的 Endpoint ,例如 shutdown、mappings、health 等,但是不包括开发者通过 @RequestMapping 注解定义的接口。
此处为了方便,Spring Security 不再连接数据库了,直接在 application.properties 中定义一个用户测试,如下
spring.security.user.name=tangsan
spring.security.user.password=123
spring.security.user.roles=ADMIN
定义完成后,重启 Spring Boot 项目,再去访问 health 端点,需要登录后才可以访问
14.1.4 端点响应缓存
对于一些不带参数的端点请求会自动进行缓存,开发者可以通过如下方式配置缓存时间
management.endpoint.beans.cache.time-to-live=100s
这个配置表示 beans 端点的缓存时间为 100s ,如果配置其它端点,只需要将 beans 修改为其它端点名称即可。
注意:如果端点添加了 Spring Security 保护,此时 Principal 会被视为端点的输入,因此端点响应将不再缓存。
14.1.5 路径映射
默认情况下,所有端点都暴露在“/actuator”路径下,例如 health 端点的访问路径为 “/actuator/health”,如果开发者需要对端点进行定制,可通过如下配置进行
management.endpoints.web.base-path=/
management.endpoints.web.path-mapping.health=healthcheck
第一行表示将 “/actuator”修改为“/”,第二行表示将“health”修改为“healthcheck”此时health端点的访问路径由“/actuator/health”变为了“/healthcheck”。
启动项目,打印日志如下

14.1.6 CORS 支持
关于 CORS 的介绍,参考四、Spring Boot 整合 Web 开发(4)
所有端点默认都没有开启跨域,开发者可以通过如下配置快速开启跨域支持
management.endpoints.web.cors.allowed-origins=http://localhost:8081
management.endpoints.web.cors.allowed-methods=GET,POST
这个配置表示允许端点处理来自 http://localhost:8081 地址的请求,允许的请求方法为 GET 和 POST
14.1.7 健康信息
1. 展示健康信息详情
开发者可以通过查看健康信息来获取应用的运行数据,进而提早发现应用问题,提早解决,避免造成损失。默认情况下,开发者只能获取到 status 信息,这是因为 detail 信息默认不显示,开发者可以通过 management.endpoint.health.show-details 来配置detail信息的显示策略,该属性的取值一共有三种:
- never 即不显示 details 信息,默认值
- when-authorized details信息只展示给认证用户,即用户登录后可以查看 details 信息,另外还可以通过 management.endpoint.health.roles 属性配置要求的角色,如果不配置,那么通过认证的用户都可以查看 details 信息,如果配置了,如 management.endpoint.health.roles=ADMIN 表示认证的用户必须具有 ADMIN 角色才能查看 details 信息
- always 将 details 信息展示给所有用户
例如,在 pom.xml 文件中引入 Spring Security 后,在 application.properties 增加如下配置
management.endpoints.web.exposure.include=*
management.endpoint.health.show-details=when_authorized
spring.security.user.name=tangsan
spring.security.user.password=123
spring.security.user.roles=ADMIN
management.endpoint.health.roles=ADMIN
这里首先暴露所有的端点,配置 health 的 details 的信息只展示给认证用户,并且认证用户还要具有 ADMIN 角色,其它配置说明略。
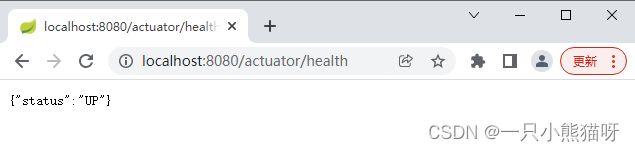
启动项目,访问“http://localhost:8080/actuator/health”

2. 健康指示器
Spring Boot 会根据 classpath 中依赖的添加情况来自动配置一些 HealthIndicators
| 名字 | 描述 |
|---|---|
| CassandraHealthIndicator | 检查Cassandra数据库状况 |
| DiskSpaceHealthIndicator | 低磁盘空间检查 |
| DataSourceHealthIndicator | 检查是否可以从DataSource获取一个Connection |
| ElasticsearchHealthIndicator | 检查Elasticsearch集群状况 |
| InfluxDbHealthIndicator | 检查InfluxDB状况 |
| JmsHealthIndicator | 检查JMS消息代理状况 |
| MailHealthIndicator | 检查邮件服务器状况 |
| MongoHealthIndicator | 检查MongoDB数据库状况 |
| Neo4jHealthIndicator | 检查Neo4j服务器状况 |
| RabbitHealthIndicator | 检查Rabbit服务器状况 |
| RedisHealthIndicator | 检查Redis服务器状况 |
| SolrHealthIndicator | 检查Solr服务器状况 |
如果项目中存在相关的依赖,那么列表中对应的 HealthIndicators 将会被自动配置,例如在 pom.xml 中添加了 Redis 依赖
<dependency>
  <groupId>org.springframework.bootgroupId>
  <artifactId>spring-boot-starter-data-redisartifactId>
  <exclusions>
    <exclusion>
      <groupId>io.lettucegroupId>
      <artifactId>lettuce-coreartifactId>
    exclusion>
  exclusions>
dependency>
<dependency>
  <groupId>redis.clientsgroupId>
  <artifactId>jedisartifactId>
dependency>
<dependency>
  <groupId>org.springframework.bootgroupId>
  <artifactId>spring-boot-starter-webartifactId>
dependency>
配置 Redis 连接信息
# ##################配置Redis连接##################
# redis使用第几个库
spring.redis.database=0
# redis地址
spring.redis.host=localhost
# redis端口
spring.redis.port=6379
# redis密码
spring.redis.password=123456
# redis连接池的最大连接数
spring.redis.jedis.pool.max-active=8
# redis连接池中最大空闲连接数
spring.redis.jedis.pool.max-idle=8
# redis连接池的最大阻塞等待时间,默认为-1,表示没有限制
spring.redis.jedis.pool.max-wait=-1ms
# redis连接池中最小空闲连接数
spring.redis.jedis.pool.min-idle=0
此时访问 health 端点,如下

若开发者不需要这么多 HealthIndicators ,可以配置关闭所有的 HealthIndicators 自动化配置
management.health.defaults.enabled=false
3. 自定义 HealthInfo
除了 Spring Boot 自动收集的这些 HealthInfo 之外,开发者也可以自定义 HealthInfo,只需要实现 HealthIndicator 接口即可
@Component
public class MyHealth implements HealthIndicator {
    @Override
    public Health health() {
        if (checkNetWork()){
            return Health.up().withDetail("msg","网络连接正常。。。").build();
        }
        return Health.up().withDetail("msg","网络断开。。。").build();
    }

    private static boolean checkNetWork(){
        return true;
    }
}
代码解释:
- 开发者自定义类实现 HealthIndicator 接口,并实现接口中的 health 方法,在 health 方法中,checkNetWork 是一个网络连接检查的方法,Health 中的 up 的 down 方法分别对应两种常见的响应状态,即“up”和“down”
- 默认的响应状态一共有4种,定义在 OrderedHealthAggregator 类中,分别是 DOWN、OUT_OF_SERVICE、UP、UNKNOWN,如果想增加响应状态,可以自定义了继承自 OrderedHealthAggregator,或者在 application.properties 中通过 management.health.status.order属性进行配置
配置完成后,假设网络连接正常,访问 health 端点,结果如下

如果开发者想要增加响应状态 FATAL ,在 application.properties 中增加如下配置
management.health.status.order=FATAL,DOWN,OUT_OF_SERVICE,UP,UNKNOWN
配置完成后,就可以在 health 方法中返回自定义的响应状态了,修改 MyHealth 的 health 方法如下
@Component
public class MyHealth implements HealthIndicator {
    @Override
    public Health health() {
        return Health.status("FATAL").withDetail("msg", "网断了...").build();
    }
}
重启项目,再次访问,如下

注意,此时虽然返回的 status 为 FATAL ,但是 HTTP 响应码是 200 ,在默认的 4 种响应状态中,DOWN、OUT_OF_SERVICE 的响应码为 503 ,UP、UNKNOWN 的响应码为 200 ,如果开发者需要对自定义的响应状态配置状态码,添加如下配置即可
management.health.status.http-mapping.FATAL=503
此时,重启项目,在此访问,如下


14.1.8 应用信息
应用信息就是通过 /actuator/info 接口获取到的信息,主要包含三大类:自定义信息、Git信息、项目构建信息
1. 自定义信息
自定义信息可以在配置文件中添加,也可以在 Java 代码中添加。
在配置文件中添加是指在 application.properties 中手动定义以 info 开头的信息,这些信息将在 info 端点中显示出来,如下
[email protected]@
[email protected]@
[email protected]@
info.author.name=tianxiadiyizei
[email protected]
注意,@…@表示引用 Maven 中的定义 。
添加这些配置后,重启项目,访问“http://localhost:8080/actuator/info”

通过 Java 代码自定义信息只需要自定义类继承自 InfoContributor,然后实现该类中的 contribute 方法即可
@Component
public class MyInfo implements InfoContributor {
    @Override
    public void contribute(Info.Builder builder) {
        Map<String, String> info = new HashMap<>();
        info.put("name", "胡歌");
        info.put("email", "[email protected]");
        builder.withDetail("author", info);
    }
}
此时访问 info 端点,如下

2. Git 信息
略(麻烦还不实用,后续用到再补充)
3. 项目构建信息
如果 classpath下存在 META-INF/build-info.properties 文件,SpringBoot 项目将自动构建BuildPropertiesBean,然后info端点会发布build-info.properties文件中的信息。build-info.properties 文件可以通过插件自动生成,具体操作步骤如下:
首先在 pom.xml 文件中添加插件:
 <plugin>
    <groupId>org.springframework.bootgroupId>
    <artifactId>spring-boot-maven-pluginartifactId>
    <executions>
        <execution>
            <goals>
                <goal>build-infogoal>
            goals>
        execution>
    executions>
plugin>
然后双击 spring-boot:build-info,生成构建信息
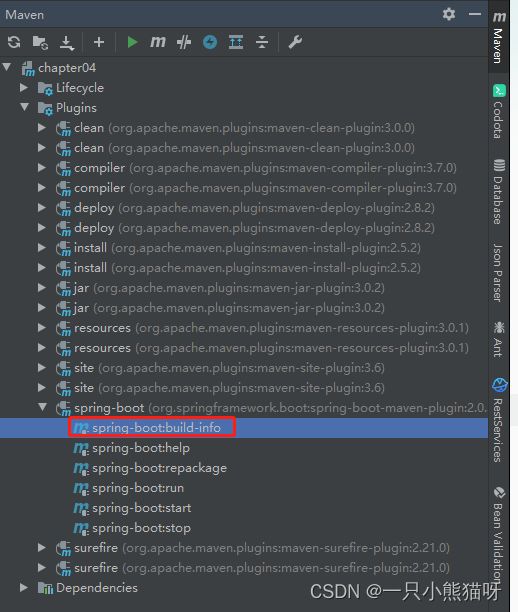
构建信息生成后,会生成一个 target/classes/META-INF/build-info.properties 文件,内容如下
#Properties
#Wed Aug 17 17:37:13 CST 2022
build.time=2022-08-17T09\:37\:13.498Z
build.artifact=chapter04
build.group=org.sang
build.name=chapter04
build.version=0.0.1-SNAPSHOT
此时启动项目,访问 info 端点,构建信息将被自动发布,如下
