全文链接:http://tecdat.cn/?p=32046
stratified cox model是针对协变量不满足PHA提出的,这里的思想是对协变量分层。
协变量的效果在一个层(部分)里是一样的,即层内没有interaction,效果是常数,这就是Non-interaction assumption。
对于”no interaction“的model,每个层的baseline function都不一样,但指数项系数一致;
查看数据
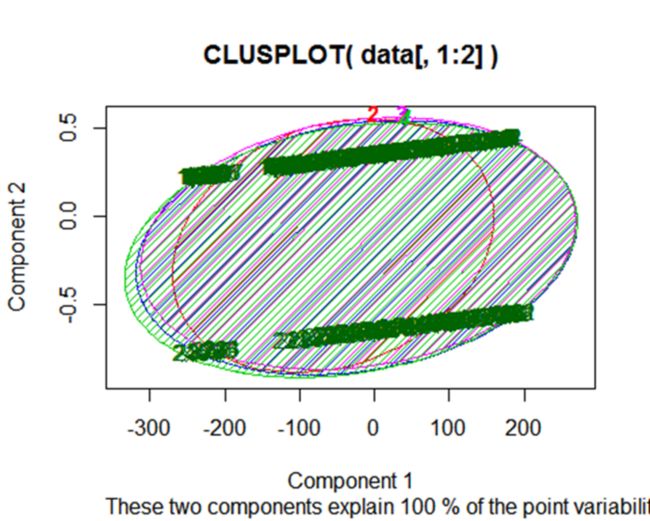
用kmeans聚类
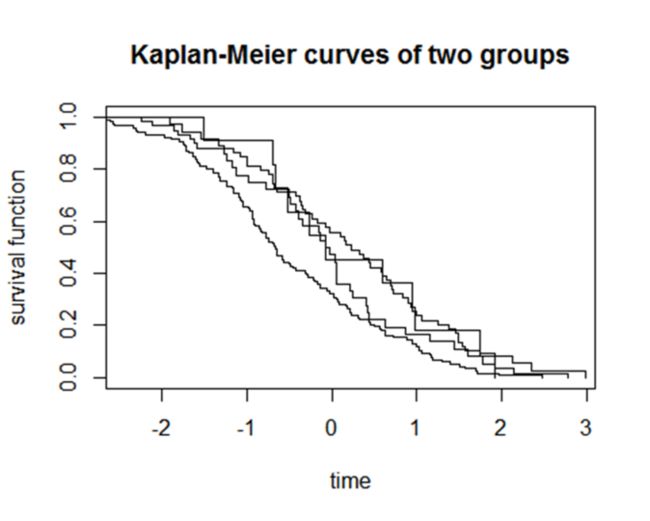
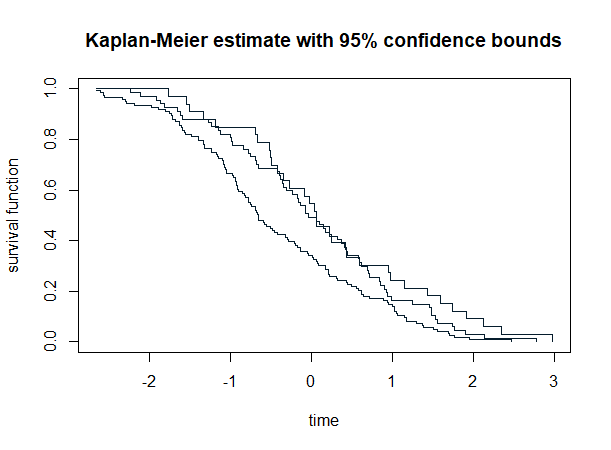
cl=kmeans(data[,c( 3,8:12)],4)对于同一组别的数据 可以观察其生存曲线以及上下95%的置信区间
survfit

## Call: survfit(formula = my.surv ~ type)
##
##          n events median 0.95LCL 0.95UCL
## type=1  36     36 -0.045   -0.42    0.25
## type=2  11     11 -0.080   -0.52      NA
## type=3  59     59  0.230   -0.23    0.71
## type=4 117    117 -0.660   -0.90   -0.29
估计KM生存曲线
##   time n.risk n.event survival std.err lower 95% CI upper 95% CI
##  -1.91    212       1    0.995 0.00471        0.986        1.000
##  -1.76    207       1    0.990 0.00670        0.977        1.000
##  -1.54    192       1    0.985 0.00842        0.969        1.000
##  -1.33    187       1    0.980 0.00989        0.961        1.000
##  -1.27    182       1    0.975 0.01121        0.953        0.997
##  -1.24    181       1    0.969 0.01237        0.945        0.994
##  -1.18    178       1    0.964 0.01345        0.938        0.991
##  -1.12    173       1    0.958 0.01448        0.930        0.987
##  -0.98    163       1    0.952 0.01554        0.922        0.983
##  -0.78    149       1    0.946 0.01669        0.914        0.979
##  -0.50    127       1    0.939 0.01815        0.904        0.975
##  -0.49    125       1    0.931 0.01950        0.894        0.970
##  -0.42    122       1    0.923 0.02078        0.884        0.965
##  -0.39    119       1    0.916 0.02200        0.874        0.960
##  -0.35    116       1    0.908 0.02319        0.863        0.954
##  -0.16    104       1    0.899 0.02455        0.852        0.948
##  -0.13    101       1    0.890 0.02587        0.841        0.942
##  -0.07     99       1    0.881 0.02713        0.830        0.936
##  -0.02     94       1    0.872 0.02841        0.818        0.929
##   0.04     91       1    0.862 0.02967        0.806        0.922
##   0.06     90       3    0.833 0.03300        0.771        0.901
##   0.22     77       1    0.823 0.03430        0.758        0.893
##   0.25     74       1    0.811 0.03559        0.745        0.884
##   0.41     69       1    0.800 0.03697        0.730        0.876
##   0.42     68       1    0.788 0.03825        0.716        0.867
##   0.43     67       1    0.776 0.03944        0.703        0.858
##   0.62     56       1    0.762 0.04110        0.686        0.847
##   0.86     47       1    0.746 0.04331        0.666        0.836
##   1.15     32       1    0.723 0.04782        0.635        0.823
##   1.44     24       1    0.693 0.05449        0.594        0.808
##   1.60     16       1    0.649 0.06609        0.532        0.793
##   2.13      6       1    0.541 0.11311        0.359        0.815
##   2.35      4       1    0.406 0.14466        0.202        0.816
##   2.98      1       1    0.000     NaN           NA           NA
在上面的图中的趋势,可以帮助我们预测在若干天结束的生存概率。
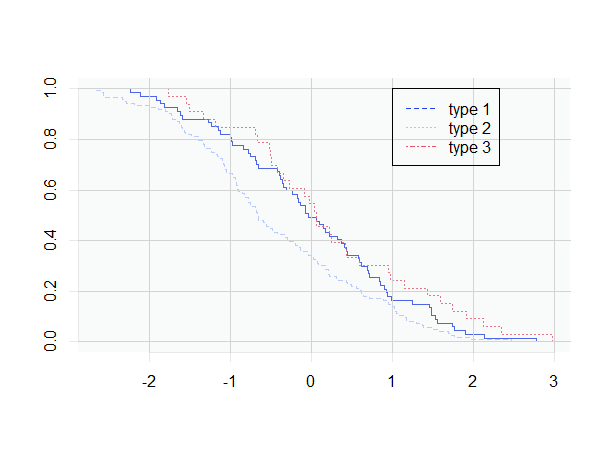
根据cl.cluster分组估计KM生存曲线
用strata来控制协变量Status 的影响
##
##                N Observed Expected (O-E)^2/E (O-E)^2/V
## cl.cluster=1  36       36     40.4   0.48265    3.7403
## cl.cluster=2  11       11     10.8   0.00256    0.0253
## cl.cluster=3  59       59     63.9   0.37821    3.0562
## cl.cluster=4 117      117    107.8   0.77924   11.2454
##
##  Chisq= 11.6  on 3 degrees of freedom, p= 0.00875
在控制Status变量之后,可以看到p值小了一些,但仍然大于0.05,因此可以认为cl.cluster对生存时间仍然没有显著影响。
用图形方法检验PH假设
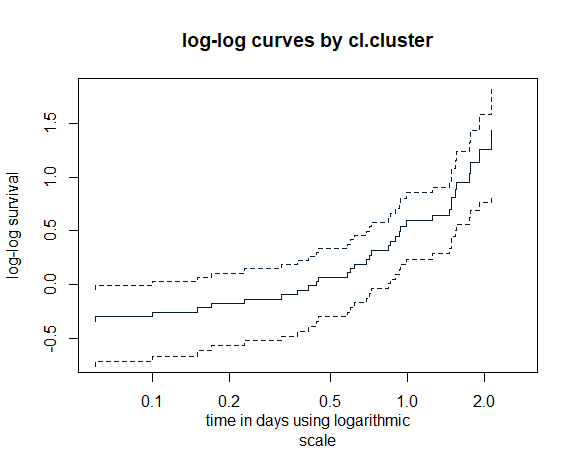
然后 对生存时间取对数plot(kmfit2,fun='clogl
生存分析一般都会用到比例风险回归模型(cox模型),但是使用cox模型的前提是比例风险一定,不随时间变动,即ph假定。
从上图的结果来看,由于两个曲线不平行,不符合PH假设。
构建COX PH回归模型
coxph(y~ .,data=data)
 summary(coxmodel)

##   n= 223, number of events= 36
##
##                        coef  exp(coef)   se(coef)      z Pr(>|z|)
## DLBCL             1.293e-03  1.001e+00  1.233e-02  0.105   0.9165
## sampleValidation  2.060e+00  7.848e+00  4.528e+00  0.455   0.6491
## X.LYM            -7.092e-01  4.920e-01  4.604e-01 -1.540   0.1234
## number.Dead      -3.326e+00  3.593e-02  4.548e+00 -0.731   0.4646
## AnalysisGCB       5.432e+00  2.285e+02  5.374e+00  1.011   0.3122
## AnalysisType      3.580e+00  3.588e+01  9.047e+00  0.396   0.6923
## SetIII            0.000e+00  1.000e+00  0.000e+00     NA       NA
## SetLow           -5.630e+00  3.589e-03  8.776e+00 -0.641   0.5212
## SetMedium        -6.406e-01  5.270e-01  5.148e+00 -0.124   0.9010
## Setmissing       -8.142e+00  2.911e-04  1.965e+02 -0.041   0.9670
## Follow.up-0.05   -4.012e-01  6.695e-01  1.611e+01 -0.025   0.9801
## Follow.up-0.08    4.992e+00  1.472e+02  2.010e+03  0.002   0.9980

## Follow.upLow     1.646e+00  6.074e-01  5.368e-05  5.049e+04
## Follow.upMedium  1.000e+00  1.000e+00  1.000e+00  1.000e+00
## X.years.         2.755e-02  3.630e+01  1.697e-04  4.472e+00
## Status           2.777e-01  3.601e+00  5.152e-03  1.497e+01
## at               1.353e+00  7.391e-01  4.076e-02  4.491e+01
## follow.up        1.598e+00  6.257e-01  3.037e-02  8.409e+01
## Subgroup         1.039e+00  9.623e-01  1.445e-03  7.472e+02
## cl.cluster       4.428e-03  2.258e+02  1.411e-05  1.390e+00
##
## Concordance= 0.992  (se = 0.056 )
## Rsquare= 0.568   (max possible= 0.749 )
## Likelihood ratio test= 187.1  on 167 df,   p=0.1367
## Wald test            = 41.93  on 167 df,   p=1
## Score (logrank) test = 473.4  on 167 df,   p=0
从回归模型的结果来看,cell2 的p值为 8.37e-05 *。
cell3 的p值为 7.15e-05 *。
显著小于0.05,因此对生存时间有显著的影响。从r方的结果来看,模型的拟合程度不是很好需要继续尝试。
两模型选择
anova(mod1,mod2)
## Analysis of Deviance Table
##  Cox model: response is  y
##  Model 1: ~ Status + cl.cluster
##  Model 2: ~ Status + cl.cluster + cl.cluster * Status
##   loglik Chisq Df P(>|Chi|)
## 1 -93.46
## 2 -93.46     0  1    0.9998
从anova的结果来看,p值大于0.05,因此两个模型没有显著的差别。也就是说cl.cluster和Status的交互作用对生存时间没有显著影响。
从回归迭代的结果来看简洁模型更好。
构建一个stratified Cox model.
由于PH假设在cl.cluster的时候不成立,因此在接下来的模型中需要控制这个变量
##   n= 223, number of events= 36
##
##          coef exp(coef) se(coef)    z Pr(>|z|)
## Status 0.5483    1.7303   0.2636 2.08   0.0375 *
## ---
## Signif. codes:  0 '***' 0.001 '**' 0.01 '*' 0.05 '.' 0.1 ' ' 1
##
##        exp(coef) exp(-coef) lower .95 upper .95
## Status      1.73     0.5779     1.032     2.901
##
## Concordance= 0.585  (se = 0.059 )
## Rsquare= 0.02   (max possible= 0.576 )
## Likelihood ratio test= 4.52  on 1 df,   p=0.03352
## Wald test            = 4.33  on 1 df,   p=0.03751
## Score (logrank) te

st = 4.33  on 1 df,   p=0.03741
从回归模型的结果来看,cell2 的p值为0.000432 ,cell3 的p值为0.000379 ,说明cell3和cell2变量对生存时间有显著的影响。
对PH假设进行统计检验
 coxph(mod1 )
##              rho    chisq     p
## Status     0.105 4.82e-01 0.487
## cl.cluster 0.262 1.10e-09 1.000
## GLOBAL        NA 4.82e-01 0.786
P值小显示PH假设不符合,显示系数变化图。
系数变化图,我们可以看到变量再不同时间段对生存时间的影响,从cell2的影响来看,一直来小于0的区域波动,说明cell2对生存时间有正相关的影响,从cell3来看,其影响也是正相关,同时随着时间增加,影响呈现先增加后减小的趋势。

