【matplotlib】可视化解决方案——如何调整轴脊位置
概述
matplotlib 的轴脊 (Spine 对象) 就是一条连接坐标轴刻度标签和刻度线的直线。在绘图区域一般有 4 根轴脊,这些轴脊可以放置在任何位置,也可以隐藏和显示。轴脊的显示主要使用 set_visible() 方法。先说说 Spine 对象,说的更准确些,它是数据区域的边界,直接继承自 Patch 类,所以可以传递线宽、表面颜色等参数。Spine 对象会根据 set_patch_line 、 set_patch_circle 方法绘制成不同的形状,可能是一条直线、一个圆或者一个圆弧。以下是它的类定义:
class Spine(mpatches.Patch):
	def __init__(self, axes, spine_type, path, **kwargs):
		...
参数说明:
- axes:包含该实例的 Axes 对象;
- spine_type:指定 Spine 对象的类型;
- path:指定绘制 Spine 对象的 Path 对象;
- kwargs:指定 Patch 对象相关的关键字参数;
示例
示例 1
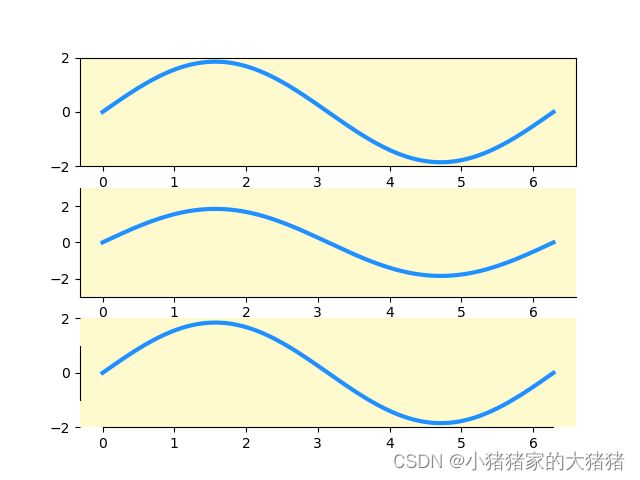
下面这个示例通过 Axes 对象的 spines 属性获得 Spine 对象字典,并对上下左右四个 Spine 对象进行设置。第一个子图是默认绘图;第二个子图将上、右轴脊进行隐藏;第三个子图将上、右轴脊颜色设置为 None,并调整左、下轴脊的边界范围。完整的代码如下:
import matplotlib.pyplot as plt
from matplotlib.spines import Spine
import numpy as np

plt.rcParams['axes.facecolor'] = "lemonchiffon"

x = np.linspace(0, 2 * np.pi, 500)
y = 1.85 * np.sin(x)

fig, ax = plt.subplots(3, 1)

ax[0].plot(x, y, lw=3, color='dodgerblue')
ax[0].set_ylim(-2, 2)

ax[1].plot(x, y, lw=3, color='dodgerblue')
ax[1].spines["right"].set_visible(False)
ax[1].spines["top"].set_visible(False)

ax[1].xaxis.set_ticks_position("bottom")
ax[1].yaxis.set_ticks_position("left")

ax[1].set_ylim(-3, 3)

ax[2].plot(x, y, lw=3, color='dodgerblue')
ax[2].spines["right"].set_color("none")
ax[2].spines["top"].set_color("none")

ax[2].xaxis.tick_bottom()
ax[2].yaxis.tick_left()

ax[2].spines["left"].set_bounds(-1, 1)
ax[2].spines["bottom"].set_bounds(0, 2 * np.pi)

ax[2].set_ylim(-2, 2)
plt.show()
画图结果如下:
这里需要补充一点,
set_ylim用来设置 Y 轴的数据显示范围,而set_bounds()方法用来设置轴脊的边界范围。两者有所不同,从绘图结果可以看出,调整轴脊的边界范围只是限定了边界线的范围,但是刻度范围不变,因为它只会受到set_ylim方法的影响,所以set_bounds()方法具有局限性。
示例 2
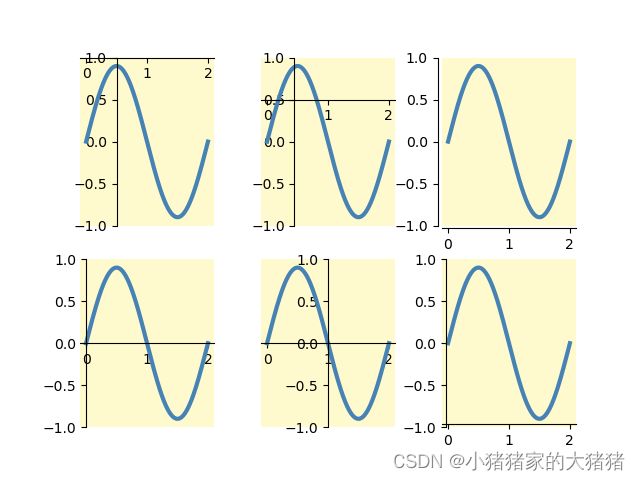
坐标轴的移动是以轴脊的位置调整作为移动对象,同时刻度线的位置也是以轴脊作为参照标准的,而刻度标签的位置又取决于刻度线的位置。因此,接下来介绍的调整轴脊位置的实现方法就具有很好的实践意义,具有"牵一发而动全身"的操作效果。具体而言,轴脊的位置调整主要通过 set_position () 方法得以实现。下面的示例演示了如何调整轴脊的各种属性,其完整代码如下:
import matplotlib.pyplot as plt
import numpy as np

plt.rcParams['axes.facecolor'] = "lemonchiffon"

x = np.linspace(0, 2, 1000)
y = 0.9 * np.sin(np.pi * x)
fig, ax = plt.subplots(2, 3)

# subplot(2,3,1)
ax[0, 0].plot(x, y, lw=3, color="steelblue")
ax[0, 0].spines["right"].set_visible(False)
ax[0, 0].spines["top"].set_visible(False)

# set left and bottom spines position
ax[0, 0].spines["left"].set_position(("data", 0.5))
ax[0, 0].spines["bottom"].set_position(("data", 1))

# set tickline position of bottom and left spines
ax[0, 0].xaxis.set_ticks_position("bottom")
ax[0, 0].yaxis.set_ticks_position("left")
ax[0, 0].set_ylim(-1, 1)

# subplot(2,3,4)
ax[1, 0].plot(x, y, lw=3, color="steelblue")
ax[1, 0].spines["right"].set_color("none")
ax[1, 0].spines["top"].set_color("none")

# set left and bottom spines position
ax[1, 0].spines["left"].set_position("zero")
ax[1, 0].spines["bottom"].set_position("zero")

# set tickline position of bottom and left spines
ax[1, 0].xaxis.tick_bottom()
ax[1, 0].yaxis.tick_left()
ax[1, 0].set_ylim(-1, 1)

# subplot(2,3,2)
ax[0, 1].plot(x, y, lw=3, color="steelblue")
ax[0, 1].spines["right"].set_visible(False)
ax[0, 1].spines["top"].set_visible(False)

# set left and bottom spines position
ax[0, 1].spines["left"].set_position(("axes", 0.25))
ax[0, 1].spines["bottom"].set_position(("axes", 0.75))

# set tickline position of bottom and left spines
ax[0, 1].xaxis.set_ticks_position("bottom")
ax[0, 1].yaxis.set_ticks_position("left")
ax[0, 1].set_ylim(-1, 1)

# subplot(2,3,5)
ax[1, 1].plot(x, y, lw=3, color="steelblue")

ax[1, 1].spines["right"].set_color("none")
ax[1, 1].spines["top"].set_color("none")
ax[1, 1].spines["left"].set_position("center")

# set left and bottom spines position
ax[1, 1].spines["bottom"].set_position("center")

# set tickline position of bottom and left spines
ax[1, 1].xaxis.tick_bottom()
ax[1, 1].yaxis.tick_left()
ax[1, 1].set_ylim(-1, 1)

# subplot(2,3,3)
ax[0, 2].plot(x, y, lw=3, color="steelblue")
ax[0, 2].spines["right"].set_visible(False)
ax[0, 2].spines["top"].set_visible(False)

# set leftandbottomspinespines position
ax[0, 2].spines["left"].set_position(("outward", 3))
ax[0, 2].spines["bottom"].set_position(("outward", 2))

# set tickline position of bottom and left spines
ax[0, 2].xaxis.set_ticks_position("bottom")
ax[0, 2].yaxis.set_ticks_position("left")
ax[0, 2].set_ylim(-1, 1)

# subplot(2,3,6)
ax[1, 2].plot(x, y, lw=3, color="steelblue")
ax[1, 2].spines["right"].set_color("none")
ax[1, 2].spines["top"].set_color("none")

# set left and bottom spines position
ax[1, 2].spines["left"].set_position(("outward", -3))
ax[1, 2].spines["bottom"].set_position(("outward", -2))

# set tickline position of bottom and left spines

ax[1, 2].xaxis.tick_bottom()
ax[1, 2].yaxis.tick_left()

ax[1, 2].set_ylim(-1, 1)

fig.subplots_adjust(wspace=0.35, hspace=0.2)
plt.show()
画图结果如下:
补充说明一下,
set_position方法可以传递一个二元元祖,也可以传递一个字符串,字符串本质是二元元祖的简写,这里只对二元元祖进行说明。
- (“data”, 5):表示使用数值坐标轴系统,轴脊放在 5 刻度线的位置;
- (“axes”, 0.25):表示使用 Axes 坐标轴系统,即将轴长度归一化到
[0, 1]之间,轴脊放置在轴长度 25%的位置;- (“outward”, 3):表示将轴脊放置在距离数据区域 3 个点的位置;
- “center”:表示将左、下轴脊都放置在 50% 的位置,等价于(“axes”, 0.5)。
往期回顾
- 【matplotlib】可视化解决方案——如何设置坐标系计量方法
- 【matplotlib】可视化解决方案——如何正确使用文本注释
- 【matplotlib】可视化解决方案——如何调整计量单位和计量方法
- 【matplotlib】可视化解决方案——如何实现图形的动画效果
- 【matplotlib】可视化解决方案——如何正确使用plot方法
- 【matplotlib】可视化解决方案——如何正确使用bar方法
- 【matplotlib】可视化解决方案——如何向画布中添加坐标轴
- 【matplotlib】可视化解决方案——如何正确使用matplotlib颜色系统
- 【matplotlib】可视化解决方案——如何实现画布局部放大功能
- 【matplotlib】可视化解决方案——如何更改matplotlib配置信息
文中难免会出现一些描述不当之处(尽管我已反复检查多次),欢迎在留言区指正,相关的知识点也可进行分享,希望大家都能有所收获!!如果觉得我的文章写得还行,不妨支持一下。你的每一个转发、关注、点赞、评论都是对我最大的支持!

