day11--Matplotlib--柱形图与盒图
Matplotlib–数据可视化库–柱形图与盒图
-
对fandango_scores.csv文件,将’FILM’,‘RT_user_norm’, ‘Metacritic_user_nom’, ‘IMDB_norm’, ‘Fandango_Ratingvalue’, 'Fandango_Stars’这6列的前5行的数据提取出来.
import pandas as pd
import matplotlib.pyplot as plt
reviews = pd.read_csv(‘fandango_scores.csv’)
cols = [‘FILM’, ‘RT_user_norm’, ‘Metacritic_user_nom’, ‘IMDB_norm’, ‘Fandango_Ratingvalue’]
norm_reviews = reviews[cols]
print(norm_reviews[:5]) -
value_counts()
Series.value_counts(normalize=False, sort=True, ascending=False, bins=None, dropna=True)
功能:返回包含唯一值计数的对象。结果对象将按降序排列,以便第一个元素是最常出现的元素。 不包括默认的NA值,返回:计数:Serise
normalize : boolean, default False
如果为True,则返回的对象将包含唯一值的相对频率。
sort : boolean, default True
按值排序
ascending : boolean, default False
按升序排序
bins : integer, optional
而不是数值计算,把它们分成半开放的箱子,一个方便的pd.cut,只适用于数字数据
dropna : boolean, default True
不包括NaN的数量。
sort_index()
Series 的 sort_index(ascending=True) 方法可以对 index 进行排序操作,ascending 参数用于控制升序或降序,默认为升序。
若要按值对 Series 进行排序,当使用 .order(na_last=True, ascending=True, kind=‘mergesort’) 方法,任何缺失值默认都会被放到 Series 的末尾。
在 DataFrame 上,.sort_index(axis=0, by=None, ascending=True) 方法多了一个轴向的选择参数与一个 by 参数,by 参数的作用是针对某一(些)列进行排序(不能对行使用 by 参数)。注意在使用sort_index对DataFrame进行排序的时候,不能直接对index和columns都含有的字段进行排序,会报错。
fandango_distribution = norm_reviews[‘Fandango_Ratingvalue’].value_counts()
fandango_distribution = fandango_distribution.sort_index()
imdb_distribution = norm_reviews[‘IMDB_norm’].value_counts()
imdb_distribution = imdb_distribution.sort_index()
print(fandango_distribution)
print(imdb_distribution)
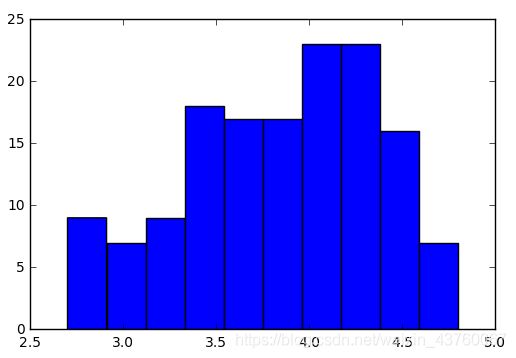
- .hist()函数参数详解
x : (n,) array or sequence of (n,) arrays
这个参数是指定每个bin(箱子)分布的数据,对应x轴
bins : integer or array_like, optional
这个参数指定bin(箱子)的个数,也就是总共有几条条状图
normed : boolean, optional
If True, the first element of the return tuple will be the counts normalized to form a probability density, i.e.,n/(len(x)`dbin)
这个参数指定密度,也就是每个条状图的占比例比,默认为1
color : color or array_like of colors or None, optional
这个指定条状图的颜色
fig, ax = plt.subplots()
ax.hist(norm_reviews[‘Fandango_Ratingvalue’])
#ax.hist(norm_reviews[‘Fandango_Ratingvalue’],bins=20)
#ax.hist(norm_reviews[‘Fandango_Ratingvalue’], range=(4, 5),bins=20)
plt.show()
- 子图绘制
.set_ylim()
设置y轴的范围,不设置的话会自动设置合适的y值范围(可视区域最大化).
还有类似的.set_xlim()
设置x轴的范围
fig.add_subplot(rows,cols,num)这里是设置plot的布局(rows, cols, num)
rows: 一页中图形的行数
cols: 一页中图形的列数
num: 绘制第几个图形(从1开始),从上往下,从左到右的原则
还有一种写法: sp = figure.add_subplot(221)
.set_title()
设置当前图形的Title
比如:sp1.set_title(“subtitle1”, fontsize=10, color=“b”)
.figure()
画图之前首先设置figure对象,此函数相当于设置一块自定义大小的画布,使得后面的图形输出在这块规定了大小的画布上,其中参数figsize设置画布大小
fig = plt.figure(figsize=(5,20))
ax1 = fig.add_subplot(4,1,1)
ax2 = fig.add_subplot(4,1,2)
ax3 = fig.add_subplot(4,1,3)
ax4 = fig.add_subplot(4,1,4)
ax1.hist(norm_reviews[‘Fandango_Ratingvalue’], bins=20, range=(0, 5))
ax1.set_title(‘Distribution of Fandango Ratings’)
ax1.set_ylim(0, 50)
ax2.hist(norm_reviews[‘RT_user_norm’], 20, range=(0, 5))
ax2.set_title(‘Distribution of Rotten Tomatoes Ratings’)
ax2.set_ylim(0, 50)
ax3.hist(norm_reviews[‘Metacritic_user_nom’], 20, range=(0, 5))
ax3.set_title(‘Distribution of Metacritic Ratings’)
ax3.set_ylim(0, 50)
ax4.hist(norm_reviews[‘IMDB_norm’], 20, range=(0, 5))
ax4.set_title(‘Distribution of IMDB Ratings’)
ax4.set_ylim(0, 50)
plt.show()
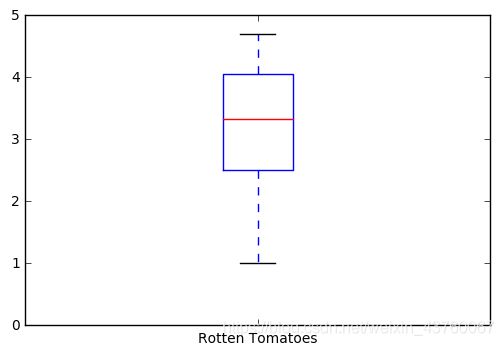
- 箱线图,又称箱形图(boxplot)或盒式图,不同于一般的折线图、柱状图或饼图等传统图表,只是数据大小、占比、趋势等等的呈现,其包含一些统计学的均值、分位数、极值等等统计量,因此,该图信息量较大,不仅能够分析不同类别数据平均水平差异(需在箱线图中加入均值点),还能揭示数据间离散程度、异常值、分布差异等等。势等等的呈现,其包含一些统计学的均值、分位数、极值等等统计量,因此,该图信息量较大,不仅能够分析不同类别数据平均水平差异(需在箱线图中加入均值点),还能揭示数据间离散程度、异常值、分布差异等等。
matplotlib库常用boxplot函数画箱线图,boxplot函数中包含n多参数,涉及到对框的颜色及形状、线段线型、均值线、异常点的形状大小等等设置,由于大多并不常用,用了几个常用参数,
sym=‘r*’,表示异常点的形状,
vert=False,表示横向还是竖向(True),,
patch_artist=True,(上下四分位框内是否填充,True为填充)
meanline=False,showmeans=True,是否有均值线及其形状,meanline=True时,均值线也像中位数线一样是条红色线段,这样容易与中位数线混淆。
另外,还有其他参数,比如notch表示中间箱体是否缺口,whis为设置数据的范围,showcaps、showbox是否显示边框.
fig, ax = plt.subplots()
ax.boxplot(norm_reviews[‘RT_user_norm’])
ax.set_xticklabels([‘Rotten Tomatoes’])
ax.set_ylim(0, 5)
plt.show()
- 绘制多个盒图
num_cols = [‘RT_user_norm’, ‘Metacritic_user_nom’, ‘IMDB_norm’, ‘Fandango_Ratingvalue’]
fig, ax = plt.subplots()
ax.boxplot(norm_reviews[num_cols].values)
ax.set_xticklabels(num_cols, rotation=90)
ax.set_ylim(0,5)
plt.show()