Python(matplotlib)画图设置正斜体,及中文宋体、英文Timenews--用于论文画图,导出高清晰图像
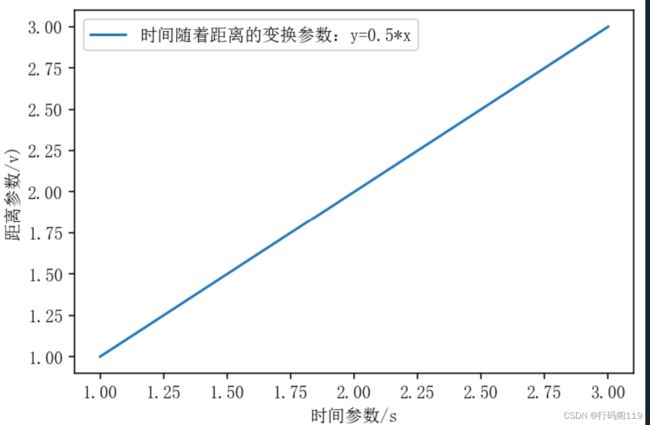
一、设置图像x、y两轴及文本标签内容为中文宋体、英文Timenews,字体为10.5磅
在代码钱加入:
config = {
            "font.family": 'serif',
            "font.size": 10.5,
            "mathtext.fontset": 'stix',
            "font.serif": ['SimSun'],
         }
rcParams.update(config)
%config InlineBackend.figure_format = 'retina'
%matplotlib inline
import numpy as np
import math
import matplotlib.pyplot as plt
from matplotlib import rcParams
config = {
"font.family": 'serif',
"font.size": 10.5,
"mathtext.fontset": 'stix',
"font.serif": ['SimSun'],
}
rcParams.update(config)
x=[1,2,3]
y=[1,2,3]
plt.plot(x, y,label="时间随着距离的变换参数:y=0.5*x")
plt.xlabel('时间参数/s')
plt.ylabel('距离参数/v)')
plt.legend() # 显示图例
plt.show()一、设置图像x、y两轴及文本标签内容整体和斜体,和mathtype格式一样
mathit:斜体
mathrm:正体
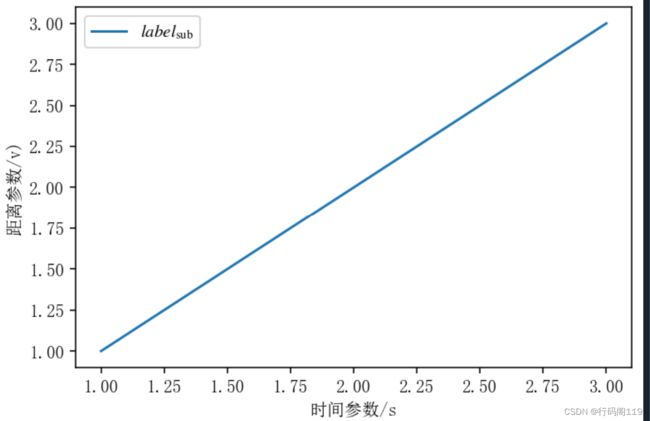
1.1 图中标签正斜体
%config InlineBackend.figure_format = 'retina'
%matplotlib inline
import numpy as np
import math
import matplotlib.pyplot as plt

from matplotlib import rcParams

config = {
            "font.family": 'serif',
            "font.size": 10.5,
            "mathtext.fontset": 'stix',
            "font.serif": ['SimSun'],
         }
rcParams.update(config)

x=[1,2,3]
y=[1,2,3]

#plt.plot(x, y,label="时间随着距离的变换参数:y=0.5*x")
plt.plot(x, y, label=r'$\mathit{label}_{\mathrm{sub}}$')
plt.xlabel('时间参数/s')
plt.ylabel('距离参数/v)')
plt.legend() # 显示图例
plt.show()
1.2 x、y轴正斜体
这里先介绍怎么同时设置上下标,看代码照着做即可
%config InlineBackend.figure_format = 'retina'
%matplotlib inline
import numpy as np
import math
import matplotlib.pyplot as plt

from matplotlib import rcParams

config = {
            "font.family": 'serif',
            "font.size": 10.5,
            "mathtext.fontset": 'stix',
            "font.serif": ['SimSun'],
         }
rcParams.update(config)

x=[1,2,3]
y=[1,2,3]

plt.plot(x, y,label="时间随着距离的变换参数:y=0.5*x")
plt.plot(x, y, label=r'$\mathit{label}_{\mathrm{sub}}$')
plt.xlabel('Time (s)')
plt.ylabel('Force ($\mathregular{F_{net}^{max}}$)')
plt.legend() # 显示图例
plt.show()
其次,上下标正斜体的设置,比如说把上图net设置为斜体:
%config InlineBackend.figure_format = 'retina'
%matplotlib inline
import numpy as np
import math
import matplotlib.pyplot as plt

from matplotlib import rcParams

config = {
            "font.family": 'serif',
            "font.size": 10.5,
            "mathtext.fontset": 'stix',
            "font.serif": ['SimSun'],
         }
rcParams.update(config)

x=[1,2,3]
y=[1,2,3]


plt.plot(x, y)
plt.xlabel('Time (s)')
plt.ylabel('Force ($\mathregular{F_{\mathit{net}}^{max}}$)')

plt.show()
其次,上下标正斜体的设置,比如说把上图net改为整体、F改为斜体:
%config InlineBackend.figure_format = 'retina'
%matplotlib inline
import numpy as np
import math
import matplotlib.pyplot as plt

from matplotlib import rcParams

config = {
            "font.family": 'serif',
            "font.size": 10.5,
            "mathtext.fontset": 'stix',
            "font.serif": ['SimSun'],
         }
rcParams.update(config)

x=[1,2,3]
y=[1,2,3]


plt.plot(x, y)
plt.xlabel('Time (s)')
plt.ylabel('Force ($\mathregular{\mathit{F}_{net}^{max}}$)')

plt.show()


