微信小程序使用echarts画饼图、条形图
首先我们需要在GitHub,下载 GitHub 上的 ecomfe/echarts-for-weixin 项目。


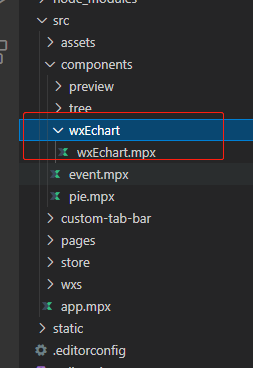
抽出组件
<script type="application/json">
  {
    "usingComponents": {
      "ec-canvas": "../../../ec-canvas/ec-canvas"
    }
  }
</script>
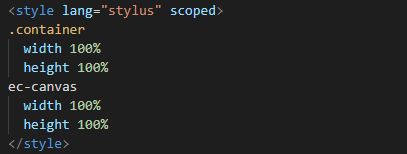
4.对应的CSS如下
源码
<template>
  <view class="container">
    <ec-canvas id="mychart-dom-bar" canvas-id="mychart-bar" ec="{{ ec }}"></ec-canvas>
  </view>
</template>
<script>
import { createComponent } from '@mpxjs/core'
import { createPage } from '@mpxjs/core'
import * as echarts from '../../../ec-canvas/echarts.js'

let chart = null

function initChart(canvas, width, height, dpr) {
  chart = echarts.init(canvas, null, {
    width: width,
    height: height,
    devicePixelRatio: dpr // new
  })
  canvas.setChart(chart)

  var option = {
    title: {
      text: '暂无数据',
      padding: [15, 100, 10, 10]
    }
  }

  chart.setOption(option)
  return chart
}
createComponent({
  data: {
    ec: {
      onInit: initChart
    }
  },
  properties: {
    option: {
      type: Object,
      value: {},
      observer: function(newVal) {
        if (newVal) {
          if (chart !== null) {
            console.log(chart)
            chart.setOption(newVal, true) // 设置数据且不merge
          } else {
            return
          }
        } else {
          return
        }
      }
    }
  },
  attached() {
    setTimeout(function() {
      // 获取 chart 实例的方式
      //   console.log(chart)
    }, 2000)
  }
})
</script>
<style lang="stylus" scoped>
.container
  width 100%
  height 100%
ec-canvas
  width 100%
  height 100%
</style>
<script type="application/json">
  {
    "usingComponents": {
      "ec-canvas": "../../../ec-canvas/ec-canvas"
    }
  }
</script>
<template>
  <view class="container">
    <wxechart option="{{option}}" />
    <button bindtap="change">改直方图数据</button>
    <button bindtap="change2">改饼图数据</button>
  </view>
</template>
<script>
import { createPage } from '@mpxjs/core'
createPage({
  data: {
    option: {}
  },
  onReady() {},
  methods: {
    change() {
      this.setData({
        option: {
          title: {
            text: '直方图'
          },
          tooltip: {
            trigger: 'axis',
            axisPointer: {
              type: 'shadow' // 默认为直线,可选为:'line' | 'shadow'
            }
          },
          grid: {
            left: 20,
            right: 20,
            bottom: 15,
            top: 40,
            containLabel: true
          },
          xAxis: [
            {
              type: 'value',
              axisLine: {
                lineStyle: {
                  color: '#5C89FF'
                }
              },
              axisLabel: {
                color: '#666'
              }
            }
          ],
          // y轴
          yAxis: [
            {
              type: 'category',
              axisTick: { show: false },
              data: [
                'XXX县',
                'XXX县',
                'XXX县',
                'XXX县',
                'XXX县',
                'XXX县',
                'XXX县',
                'XXX县',
                'XXX县',
                'XXX县'
              ],
              axisLine: {
                lineStyle: {
                  color: '#999'
                }
              },
              axisLabel: {
                color: '#666'
              }
            }
          ],
          series: [
            {
              name: '人口',
              type: 'bar',
              label: {
                normal: {
                  formatter: '{c}',
                  show: true,
                  textStyle: {
                    fontSize: '12',
                    color: '#fff'
                  }
                }
              },
              // data: [],
              data: [1000, 2000, 3000, 4000, 5000, 6000, 7000, 8000, 9000, 10000],
              itemStyle: {
                color: '#E92F20',
                barBorderRadius: [0, 16, 16, 0]
              },
              barWidth: '25'
            }
          ]
        }
      })
    },
    change2() {
      this.setData({
        option: {
          backgroundColor: '#ffffff',
          title: {
            text: '某站点用户访问来源'
          },
          tooltip: {
            trigger: 'item',
            formatter: '{a} \n{b} : {c} ({d}%)'
          },
          legend: {
            orient: 'vertical',
            left: '5%',
            right: '5%',
            bottom: '10%',
            orient: 'horizontal',
            textStyle: {
              fontSize: 12
            },
            data: ['直接访问', '邮件营销', '联盟广告', '视频广告', '搜索引擎']
          },
          series: [
            {
              name: '访问来源',
              type: 'pie',
              center: ['50%', '50%'],
              radius: ['40%', '60%'],
              data: [
                { value: 335, name: '直接访问' },
                { value: 310, name: '邮件营销' },
                { value: 234, name: '联盟广告' },
                { value: 135, name: '视频广告' },
                { value: 1548, name: '搜索引擎' }
              ],
              emphasis: {
                itemStyle: {
                  shadowBlur: 10,
                  shadowOffsetX: 0,
                  shadowColor: 'rgba(0, 0, 0, 0.5)'
                }
              }
            }
          ]
        }
      })
    }
  }
})
</script>
<style lang="stylus" scoped>
.container
  width 100%
  height 600px
</style>
<script type="application/json">
  {
    "navigationBarTitleText": "canvas柱状图",
    "usingComponents": {
      "wxechart": "../components/wxEchart/wxEchart"
    }
  }
</script>
效果
开始


