ELK-日志服务【es-安装使用】
目录
【1】安装-配置elasticsearch(01、02、03相同)
端口
【2】安装-配置-启动-Kibana
【3】浏览器访问测试(10.0.0.21:5601)
【4】使用kibana创建、更新、删除es索引、文档
【5】组es集群(投票选举机制)
【6】启动es
【7】验证集群是否正常
【8】使用kibana或者cerebro创建索引
【9】es-role(角色)
【10】集群分片 shard-replicas 的作用与如何使用
【11】创建索引设置为3个分片、1个副本
【12】如果后期我们增加了节点会不会提高es节点的容量?
【13】es集群的健康检测
| es-01 |
10.0.0.21 |
| es-02 |
10.0.0.22 |
| es-03 |
10.0.0.23 |
【1】安装-配置elasticsearch(01、02、03相同)
[root@es-01 ~]# yum -y install java

[root@es-01 ~]# yum -y localinstall elasticsearch-7.4.0-x86_64.rpm
[root@es-01 ~]# vim /etc/elasticsearch/jvm.options
-Xms512m
-Xmx512m

[root@es-01 ~]# systemctl enable elasticsearch.service
[root@es-01 ~]# systemctl start elasticsearch.service

[root@es-01 ~]# netstat -lntp
Active Internet connections (only servers)
Proto Recv-Q Send-Q Local Address           Foreign Address         State       PID/Program name
tcp        0      0 0.0.0.0:22              0.0.0.0:*               LISTEN      881/sshd
tcp        0      0 127.0.0.1:25            0.0.0.0:*               LISTEN      1144/master
tcp6       0      0 127.0.0.1:9200          :::*                    LISTEN      2555/java
tcp6       0      0 ::1:9200                :::*                    LISTEN      2555/java
tcp6       0      0 127.0.0.1:9300          :::*                    LISTEN      2555/java
tcp6       0      0 ::1:9300                :::*                    LISTEN      2555/java
tcp6       0      0 :::22                   :::*                    LISTEN      881/sshd
tcp6       0      0 ::1:25                  :::*                    LISTEN      1144/master
端口
- 9200:对外提供访问
- 9300:集群之间通信
【2】安装-配置-启动-Kibana
[root@es-01 ~]# yum -y localinstall kibana-7.4.0-x86_64.rpm
[root@es-01 ~]# grep "^[a-Z]" /etc/kibana/kibana.yml
server.port: 5601
server.host: "0.0.0.0"
elasticsearch.hosts: ["http://10.0.0.21:9200"]
i18n.locale: "zh-CN"

[root@es-01 ~]# systemctl enable kibana
[root@es-01 ~]# systemctl start kibana.service

[root@es-01 ~]# netstat -lntp
Active Internet connections (only servers)
Proto Recv-Q Send-Q Local Address           Foreign Address         State       PID/Program name
tcp        0      0 0.0.0.0:22              0.0.0.0:*               LISTEN      881/sshd
tcp        0      0 127.0.0.1:25            0.0.0.0:*               LISTEN      1144/master
tcp        0      0 127.0.0.1:5601          0.0.0.0:*               LISTEN      2775/node
tcp6       0      0 127.0.0.1:9200          :::*                    LISTEN      2555/java
tcp6       0      0 ::1:9200                :::*                    LISTEN      2555/java
tcp6       0      0 127.0.0.1:9300          :::*                    LISTEN      2555/java
tcp6       0      0 ::1:9300                :::*                    LISTEN      2555/java
tcp6       0      0 :::22                   :::*                    LISTEN      881/sshd
tcp6       0      0 ::1:25                  :::*                    LISTEN      1144/master
【3】浏览器访问测试(10.0.0.21:5601)

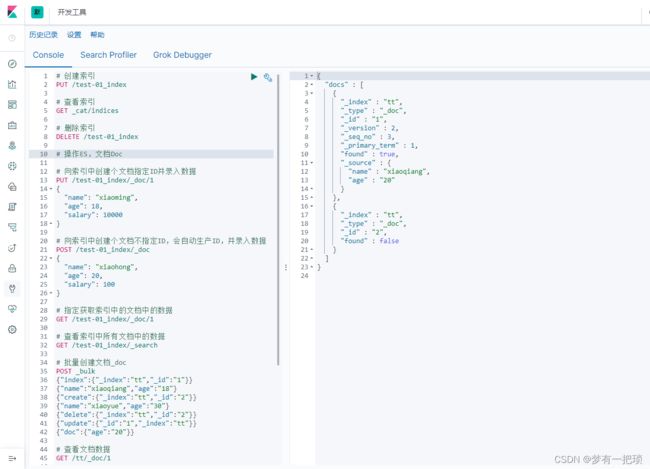
【4】使用kibana创建、更新、删除es索引、文档
# 创建索引
PUT /test-01_index

# 查看索引
GET _cat/indices

# 删除索引
DELETE /test-01_index

# 操作ES,文档Doc

# 向索引中创建个文档指定ID并录入数据
PUT /test-01_index/_doc/1
{
  "name": "xiaoming",
  "age": 18,
  "salary": 10000
}

# 向索引中创建个文档不指定ID,会自动生产ID,并录入数据
POST /test-01_index/_doc
{
  "name": "xiaohong",
  "age": 20,
  "salary": 100
}

# 指定获取索引中的文档中的数据
GET /test-01_index/_doc/1

# 查看索引中所有文档中的数据
GET /test-01_index/_search

# 批量创建文档_doc
POST _bulk
{"index":{"_index":"tt","_id":"1"}}
{"name":"xiaoqiang","age":"18"}
{"create":{"_index":"tt","_id":"2"}}
{"name":"xiaoyue","age":"30"}
{"delete":{"_index":"tt","_id":"2"}}
{"update":{"_id":"1","_index":"tt"}}
{"doc":{"age":"20"}}

# 查看文档数据
GET /tt/_doc/1

# 批量查看文档
GET _mget
{
  "docs":[
    {
      "_index":"tt",
      "_id":"1"
    },
    {
      "_index":"tt",
      "_id":"2"
    }
    ]
}
【5】组es集群(投票选举机制)
- es-01
## 由于先前我们已经安装过es并启动,他会认为自己就是master,我们需要停止服务,并清除数据
[root@es-01 ~]# systemctl stop elasticsearch.service
[root@es-01 ~]# rm -rf /var/lib/elasticsearch/*

[root@es-01 ~]# grep "^[a-Z]" /etc/elasticsearch/elasticsearch.yml
cluster.name: my-cluster-test        # 集群名称
node.name: es-node01                 # 集群中节点名称
path.data: /var/lib/elasticsearch    # 数据存储的路径
path.logs: /var/log/elasticsearch    # 日志存储的路径
#bootstrap.memory_lock: true
         # 不使用swap分区
network.host: 10.0.0.21
              # 本机IP
http.port: 9200
                      # 监听的端口
discovery.seed_hosts: ["10.0.0.21", "10.0.0.22","10.0.0.23"]            # 集群节点
cluster.initial_master_nodes: ["10.0.0.21", "10.0.0.22","10.0.0.23"] # 进第一次启动es时选举- es-02
## 由于先前我们已经安装过es并启动,他会认为自己就是master,我们需要停止服务,并清除数据
[root@es-01 ~]# systemctl stop elasticsearch.service
[root@es-01 ~]# rm -rf /var/lib/elasticsearch/*

[root@es-02 ~]# grep "^[a-Z]" /etc/elasticsearch/elasticsearch.yml
cluster.name: my-cluster-test
node.name: es-node02
path.data: /var/lib/elasticsearch
path.logs: /var/log/elasticsearch
#bootstrap.memory_lock: true
network.host: 10.0.0.22
http.port: 9200
discovery.seed_hosts: ["10.0.0.21", "10.0.0.22","10.0.0.23"]
cluster.initial_master_nodes: ["10.0.0.21", "10.0.0.22","10.0.0.23"]- es-03
## 由于先前我们已经安装过es并启动,他会认为自己就是master,我们需要停止服务,并清除数据
[root@es-01 ~]# systemctl stop elasticsearch.service
[root@es-01 ~]# rm -rf /var/lib/elasticsearch/*

[root@es-03 ~]# grep "^[a-Z]" /etc/elasticsearch/elasticsearch.yml
cluster.name: my-cluster-test
node.name: es-node03
path.data: /var/lib/elasticsearch
path.logs: /var/log/elasticsearch
#bootstrap.memory_lock: true
network.host: 10.0.0.23
http.port: 9200
discovery.seed_hosts: ["10.0.0.21", "10.0.0.22","10.0.0.23"]
cluster.initial_master_nodes: ["10.0.0.21", "10.0.0.22","10.0.0.23"]
【6】启动es
[root@es-01 ~]# systemctl start elasticsearch.service
[root@es-02 ~]# systemctl start elasticsearch.service
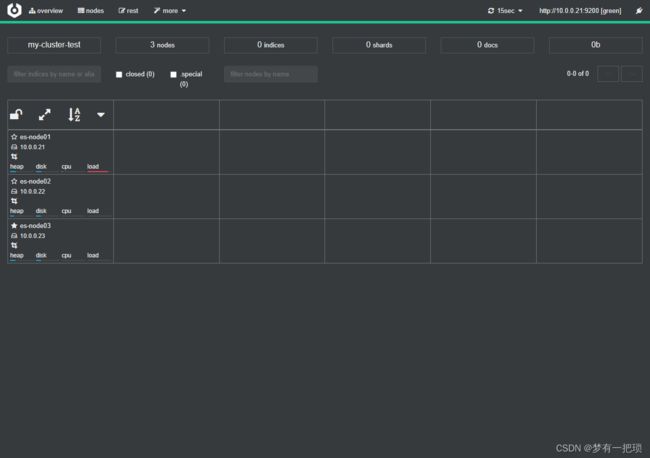
[root@es-03 ~]# systemctl start elasticsearch.service【7】验证集群是否正常
- curl
[root@es-01 ~]# curl http://10.0.0.21:9200/_cat/health?v
epoch      timestamp cluster         status node.total node.data shards pri relo init unassign pending_tasks max_task_wait_time active_shards_percent
1689037180 00:59:40 my-cluster-test green 3 3 0 0 0 0 0 0 - 100.0%- 安装cerebro验证(端口:9000)
[root@es-01 ~]# rpm -ivh cerebro-0.8.5-1.noarch.rpm
Preparing...                          ################################# [100%]
Creating system group: cerebro
Creating system user: cerebro in cerebro with cerebro user-daemon and shell /bin/false
Updating / installing...
   1:cerebro-0.8.5-1                  ################################# [100%]
Created symlink from /etc/systemd/system/multi-user.target.wants/cerebro.service to /usr/lib/systemd/system/cerebro.service.

[root@es-01 ~]# vim /etc/cerebro/application.conf
data.path = "/tmp/cerebro.db"

[root@es-01 ~]# systemctl start cerebro

[root@es-01 ~]# netstat -lntp
Active Internet connections (only servers)
Proto Recv-Q Send-Q Local Address           Foreign Address         State       PID/Program name
tcp        0      0 0.0.0.0:22              0.0.0.0:*               LISTEN      881/sshd
tcp        0      0 127.0.0.1:25            0.0.0.0:*               LISTEN      1144/master
tcp        0      0 0.0.0.0:5601            0.0.0.0:*               LISTEN      2894/node
tcp6       0      0 10.0.0.21:9200          :::*                    LISTEN      12790/java
tcp6       0      0 10.0.0.21:9300          :::*                    LISTEN      12790/java
tcp6       0      0 :::22                   :::*                    LISTEN      881/sshd
tcp6       0      0 ::1:25                  :::*                    LISTEN      1144/master
tcp6 0 0 :::9000 :::* LISTEN 13146/java 
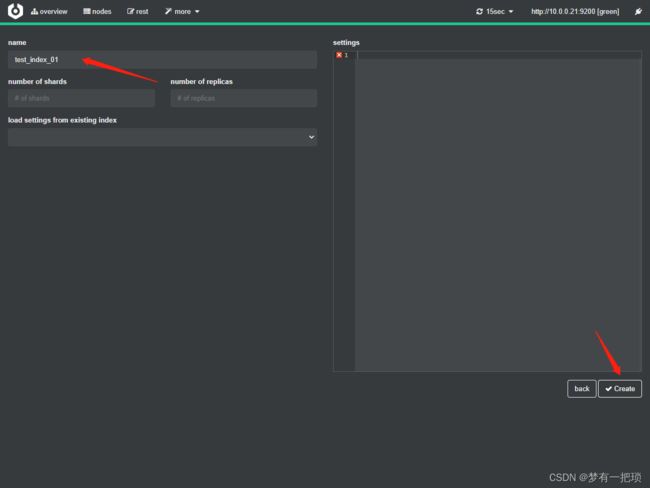
【8】使用kibana或者cerebro创建索引


【9】es-role(角色)
- Cluster State
集群相关数据,会存储到每个节点中(1、节点信息 2、索引信息)
- Master
1、Es集群中只有一个Master节点,作用于控制整个集群
2、Master主要维护Cluster State,当有新的数据产生后,Master就会将数据同步给其他node节点
3、Master节点是通过选举产生的,可以通过node.master: ture 表示可以参与选举
4、当我们通过API创建索引 PUT /test_index ,Cluster State 就会发生变化,同步给其他节点
- Data
存储数据的节点就是Data节点。默认节点都是data类型
当创建索引后,索引中的数据就会存储在默认节点中,能够存储数据的就是Data节点
node.master:false , node.data:true
- Coordinating
处理请求的节点,所有节点默认,不能取消 Coordinating节点主要将请求路由到正确的节点处理,如创建索引的请求会通过coordinating路由到master节点处理
node.master:false , node.data:false
【10】集群分片 shard-replicas 的作用与如何使用
- 增强es的高可用性
1、服务可用性
1)3个节点的情况下,允许其中1台节点出现故障
2)多节点的情况下,出现故障的节点不能超过集群的一半
2、数据可用性
1)通过副本 replication 解决,保证每个节点都有完备的数据
- 增大es集群的容量
1、需要将数据均匀的分布在所有节点上,引入分片 share 解决
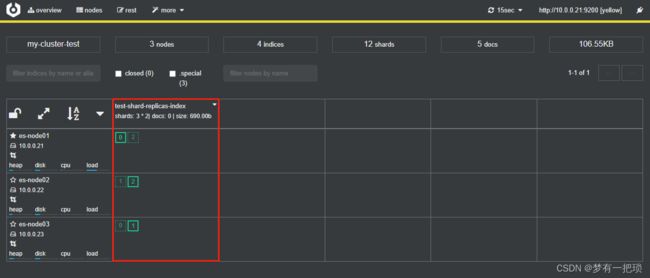
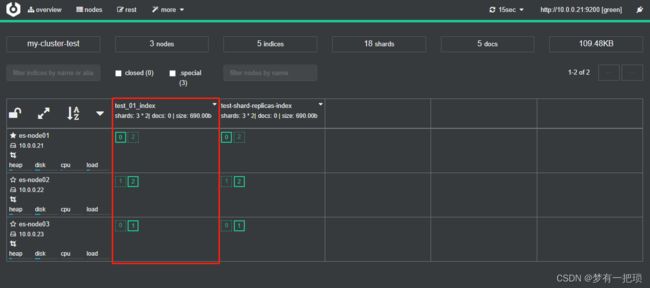
【11】创建索引设置为3个分片、1个副本
- 使用cerebor创建方式

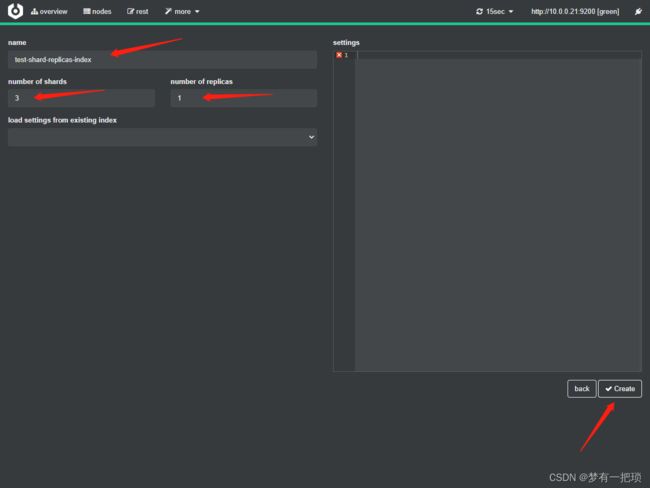
- 使用kibana创建方式
PUT /test_01_index
{
  "settings": {
    "index": {
      "number_of_shards": 3,
      "number_of_replicas": 1
    }
  }
}
【12】如果后期我们增加了节点会不会提高es节点的容量?
1、对于以前存在的index分片,他们已经分布在3台节点上,那么我们在增加第四台节点,数据不会发生改变,之前存在的index数据也不会被分布在第四台节点上
2、之后产生的index数据分片才会在四台节点分布
【13】es集群的健康检测
- Cluster Health 获取集群的健康状态,以下三种
1、grenn 所有主副分片都正常分片
2、yellow 主分片正常,但是副本分片未正常分配
3、red 主分片未分配,表示索引不完备,写可能出些问题(但是不能代表不能存储数据和读取数据)