通过echarts绘制双十一销量实时统计图表
echarts 是apache的一个孵化项目,这次我们利用它的api,来实现了kintone门户页面的双十一的销量实时统计的Dashboard 。
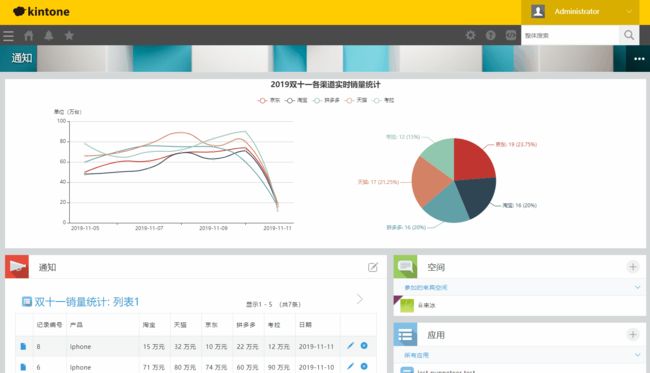
我们先看下效果图。
折线图显示了双十一期间的产品销量走势,而饼图则显示了各渠道的产品销量的占比,同时他们都是实时变化的。
接下来我们就来看下它是怎么实现的。
公用的库
下面是我们要用到的库:
echarts
kintone JS SDK
※ 这里不对这两个库做具体介绍,如果还不熟悉它们,请先参阅相关文档。
graph.js
(应用列表页和应用详情页显示绘图的js,为了方便这边将pc端和mobile端的代码整合到了一起。)
(function () {
    'use strict';
    kintone.events.on(['app.record.detail.show', 'app.record.edit.show'], function (res) {
        const pcSetting = {
            type: 'pc',
            showContent: true,
            style: "width: 600px;height:400px;",
        };
        generateDetail(pcSetting, res);
    });
    kintone.events.on(['mobile.app.record.detail.show', 'mobile.app.record.edit.show'], function (res) {
        const mobileSetting = {
            type: 'mobile',
            showContent: false,
            style: "width: 350px;height:400px;",
        };
        generateDetail(mobileSetting, res);
    });
    kintone.events.on(['app.record.index.show'], function (res) {
        const pcSetting = {
            type: 'pc',
            showContent: true,
            style: "width: 900px;height:400px;"
        };
        generateTotal(pcSetting);
    });
    kintone.events.on(['mobile.app.record.index.show'], function (res) {
        const mobileSetting = {
            type: 'mobile',
            showContent: false,
            style: "width: 350px;height:400px;"
        };
        generateTotal(mobileSetting);
    });
    function generateDetail(setting, res) {
        var record = res.record;
        var report_el;
        if (setting.type === "mobile") {
            report_el = kintone.mobile.app.record.getSpaceElement("report");
        }
        else {
            report_el = kintone.app.record.getSpaceElement("report");
        }
        var report_div = document.createElement('div');
        report_div.id = "graph";
        report_div.style = setting.style;
        var myChart = echarts.init(report_div);
        var option = {
            title: {
                text: '各渠道销量统计',
                x: 'center'
            },
            tooltip: {
                trigger: 'item',
                formatter: "{a}
{b} : {c} ({d}%)",
                showContent: setting.showContent
            },
            legend: {
                orient: 'vertical',
                left: 'left',
                data: ['京东', '淘宝', '拼多多', '天猫', '考拉']
            },
            series: [
                {
                    name: '假期类型',
                    type: 'pie',
                    radius: '55%',
                    center: ['50%', '60%'],
                    data: [
                        { value: record.channel1.value, name: '京东' },
                        { value: record.channel2.value, name: '淘宝' },
                        { value: record.channel3.value, name: '拼多多' },
                        { value: record.channel4.value, name: '天猫' },
                        { value: record.channel5.value, name: '考拉' }
                    ],
                    itemStyle: {
                        emphasis: {
                            shadowBlur: 10,
                            shadowOffsetX: 0,
                            shadowColor: 'rgba(0, 0, 0, 0.5)'
                        }
                    }
                }
            ]
        };
        myChart.setOption(option);
        report_el.appendChild(report_div);
    }
    function generateTotal(setting) {
        if (document.getElementById('graph') !== null) {
            return;
        }
        var graph = document.createElement('div');
        graph.id = 'graph';
        graph.style = setting.style;
        var app;
        if (setting.type === "mobile") {
            kintone.mobile.app.getHeaderSpaceElement().appendChild(graph);
            app = kintone.mobile.app.getId();
        }
        else {
            kintone.app.getHeaderSpaceElement().appendChild(graph);
            app = kintone.app.getId();
        }
        var myChart = echarts.init(graph);
        var kintoneRecord = new kintoneJSSDK.Record();
        var rcOption = {
            app: app,
            query: 'order by date asc'
        };
        kintoneRecord.getAllRecordsByCursor(rcOption).then((rsp) => {
            var records = rsp.records;
            var graphData = { 'channel1': [], 'channel2': [], 'channel3': [], 'channel4': [], 'channel5': [] };
            var dateArray = [];
            for (var record of records) {
                var dateKey = record.date.value;
                graphData.channel1.push(record.channel1.value);
                graphData.channel2.push(record.channel2.value);
                graphData.channel3.push(record.channel3.value);
                graphData.channel4.push(record.channel4.value);
                graphData.channel5.push(record.channel5.value);
                dateArray.push(dateKey);
            }
            var option = {
                tooltip: {
                    trigger: 'axis',
                    axisPointer: {
                        type: 'shadow'
                    },
                    showContent: setting.showContent
                },
                legend: {
                    data: ['京东', '淘宝', '拼多多', '天猫', '考拉']
                },
                grid: {
                    left: '3%',
                    right: '4%',
                    bottom: '3%',
                    containLabel: true
                },
                xAxis: {
                    type: 'value'
                },
                yAxis: {
                    type: 'category',
                    data: dateArray
                },
                series: [
                    {
                        name: '京东',
                        type: 'bar',
                        stack: '总量',
                        label: {
                            normal: {
                                show: true,
                                position: 'insideRight'
                            }
                        },
                        data: graphData.channel1
                    },
                    {
                        name: '淘宝',
                        type: 'bar',
                        stack: '总量',
                        label: {
                            normal: {
                                show: true,
                                position: 'insideRight'
                            }
                        },
                        data: graphData.channel2
                    },
                    {
                        name: '拼多多',
                        type: 'bar',
                        stack: '总量',
                        label: {
                            normal: {
                                show: true,
                                position: 'insideRight'
                            }
                        },
                        data: graphData.channel3
                    },
                    {
                        name: '天猫',
                        type: 'bar',
                        stack: '总量',
                        label: {
                            normal: {
                                show: true,
                                position: 'insideRight'
                            }
                        },
                        data: graphData.channel4
                    },
                    {
                        name: '考拉',
                        type: 'bar',
                        stack: '总量',
                        label: {
                            normal: {
                                show: true,
                                position: 'insideRight'
                            }
                        },
                        data: graphData.channel5
                    }
                ]
            };
            myChart.setOption(option);
        }).catch((err) => {
            document.getElementById('graph').innerText = "获取数据失败";
        });
    }
}());
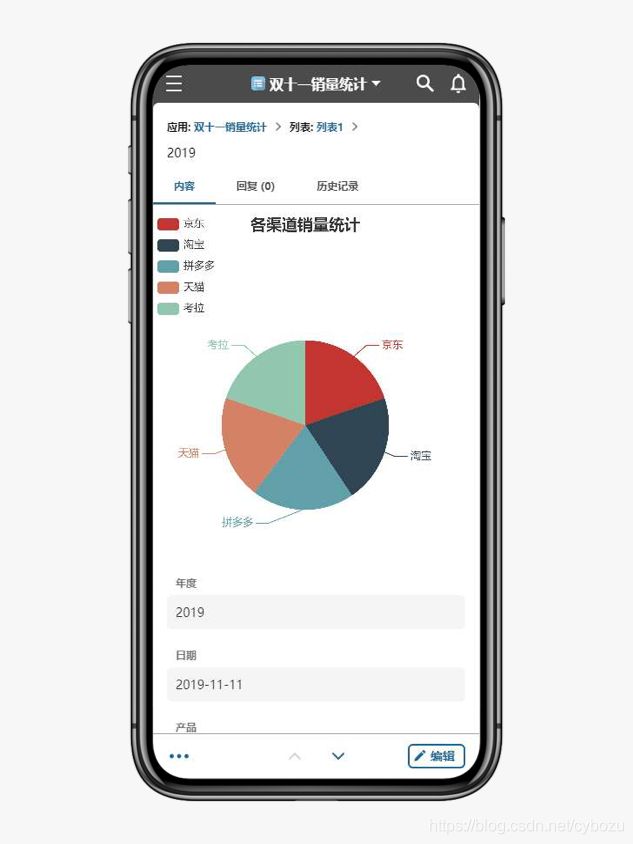
手机端画面:
pc端画面:
具体代码包括首页的实时变化数据的图表代码请参考完整文章:
双十一销量实时统计图表 - cybozu - cybozu开发者网站


