Antv L7 + mapbox 实现简单地图场景
实现场景
1.创建地图场景
2.自定义marker样式

3.mapbox 实现3D地图
代码实现
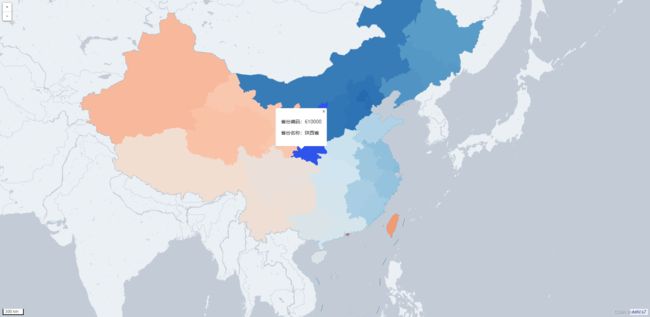
1.创建地图场景
<!DOCTYPE html>
<html lang="en">
<head>
    <meta charset="UTF-8">
    <title>创建地图场景</title>
    <style>
       html,body{overflow:hidden;margin:0;}
    	#map { position:absolute; top:0; bottom:0; width:100%; }
    </style>
</head>
<body>
<div id="map"></div>
<script src="https://unpkg.com/@antv/l7"></script>
<script src="https://webapi.amap.com/maps?v=1.4.8&key=15cd8a57710d40c9b7c0e3cc120f1200&plugin=Map3D"></script>
<script src="https://gw.alipayobjects.com/os/antv/assets/lib/jquery-3.2.1.min.js"></script>
<script src="https://gw.alipayobjects.com/os/antv/pkg/_antv.l7-1.3.0-beta.4/build/L7-min.js"></script>
<script>
  var scene = new L7.Scene({
    id: 'map',
    mapStyle: 'light', // 样式URL
    center: [108.947092, 34.260706],
    pitch: 0,
    zoom: 5,
	token: 'ec8e931ea3665171aa0b57d5a3aefa36',
  });
  scene.on('loaded', function() {
    $.getJSON('https://geo.datav.aliyun.com/areas_v3/bound/100000_full.json', function(city) {
      var layer = scene.PolygonLayer().source(city).color('adcode', ['#b2182b', '#ef8a62', '#fddbc7', '#d1e5f0', '#67a9cf', '#2166ac'].reverse()).shape('fill').active(true).style({
        opacity: 2
      }).render();
      scene.PolygonLayer().source(city).color('#67a9cf').shape('line').style({
        opacity: 2
      }).render();
      var popup = new L7.Popup();
      layer.on('mousemove', function(e) {
        var lnglat = e.lnglat,
        feature = e.feature;
        var html = '\n省份编码:' + feature.properties.adcode+ '\n 省份名称:' + feature.properties.name + '';
        popup.setLnglat([lnglat.lng, lnglat.lat]).setHTML(html).addTo(scene);
      });
    });
  });
</script>
</body>
</html>
2.自定义marker样式
<!DOCTYPE html>
<html lang="en">
<head>
    <meta charset="UTF-8">
    <title>创建地图场景</title>
    <style>
       html,body{overflow:hidden;margin:0;}
    	#map { position:absolute; top:0; bottom:0; width:100%; }
		.marker{
			font-size: 14px;
			color: white;
			text-align: center;
		}
		.marker img{
			width: 1.25rem;
			height: 1.25rem;
		}
    </style>
</head>
<body>
<div id="map">

</div>
<script src="https://unpkg.com/@antv/l7"></script>
<script src="https://webapi.amap.com/maps?v=1.4.8&key=15cd8a57710d40c9b7c0e3cc120f1200&plugin=Map3D"></script>
<script src="https://gw.alipayobjects.com/os/antv/assets/lib/jquery-3.2.1.min.js"></script>
<script src="https://gw.alipayobjects.com/os/antv/pkg/_antv.l7-1.3.0-beta.4/build/L7-min.js"></script>
<script>
  var scene = new L7.Scene({
    id: 'map',
	mapStyle: 'amap://styles/darkblue',//前往创建自定义地图样式:https://lbs.amap.com/dev/mapstyle/index
    center: [110.497005, 38.835641],//中心点位置
	style: 'dark',
    zoom: 9,//缩放等级
	minZoom:9,//最小缩放等级
	maxZoom:22,//最大缩放等级
	token: 'ec8e931ea3665171aa0b57d5a3aefa36',
  });
  scene.on('loaded', function() {
    $.getJSON('https://geo.datav.aliyun.com/areas_v3/bound/610881.json', function(city) {
	  //面
	  var layer = scene.PolygonLayer().source(city).color('#2a71d0').shape('fill').style({opacity: 1}).render();
	  //线
	  layer = scene.PolygonLayer().source(city).color('#0e3669').shape('line').style({opacity: 3}).render();
	  let features = city.features;
	  features.forEach((item, i) => {
		  // 自定义marker样式
		  let el = document.createElement("div");
		  el.className = "marker-wrap";
		  el.innerHTML = `<div class="marker"><span class="title"><img src="./image/sm.png" /></span></div>
				<div class="marker"><span class="title">${item.properties.name}</span></div>`
		  new L7.Marker({element: el,}).setLnglat(item.properties.center).addTo(scene);
	  });
    });
	//添加企业marker(可以根据动态数据,动态添加多个企业点位)
	//获取企业位置数据
	$.getJSON('./json/qywz.json', function(city) {
	   let features = city.features;
	    features.forEach((item, i) => {
			let el = document.createElement("div");
			el.className = "marker-wrap";
			el.innerHTML = `<div class="marker"><span class="title"><img src="./image/qy.png" /></span></div>`
			new L7.Marker({element: el,}).setLnglat(item.geometry.coordinates).addTo(scene);
		});
	});
  });
</script>
</body>
</html>
3.mapbox 实现3D地图
<!DOCTYPE html>
<html>
	<head>
		<meta charset="utf-8">
		<title>Antv L7 + mapbox 实现3D地图</title>
		<style>
		   html,body{overflow:hidden;margin:0;}
			#idMap { position:absolute; top:0; bottom:0; width:100%; }
		</style>
	</head>
	<body>
		<div id="idMap">
		</div>
		<script src='https://api.mapbox.com/mapbox-gl-js/v2.9.1/mapbox-gl.js'></script>
		<!-- <link href='https://api.mapbox.com/mapbox-gl-js/v2.9.1/mapbox-gl.css' rel='stylesheet' /> -->
		<script src = 'https://unpkg.com/@antv/l7'></script>
		<script>
		    //mapboxgl.accessToken = 'pk.------------------你的mapboxtoken';
			const scene = new L7.Scene({
				id: 'idMap',
				map: new L7.Mapbox({
					style: 'dark',
					center: [ 110.497005, 38.835641 ],
					pitch: 20,
					zoom: 3.8,
				})
			});
			scene.on('loaded', () => {
				let lineDown,lineUp,textLayer;
				fetch('https://geo.datav.aliyun.com/areas_v3/bound/100000_full.json')
					.then(res => res.json())
					.then(data => {
						const texts = [];
						data.features.map(option => {
							const { name, center } = option.properties;
							const [ lng, lat ] = center || [];
							texts.push({ name, lng, lat });
							return '';
						});
						// textLayer = new L7.PointLayer({ zIndex: 2 })
						// 	.source(texts, {
						// 		parser: {
						// 			type: 'json',
						// 			x: 'lng',
						// 			y: 'lat'
						// 		}
						// 	})
						// 	.shape('name', 'text')
						// 	.size(14)
						// 	.color('#0ff')
						// 	.style({
						// 		textAnchor: 'center', // 文本相对锚点的位置 center|left|right|top|bottom|top-left
						// 		spacing: 1, // 字符间距
						// 		padding: [ 1, 1 ], // 文本包围盒 padding [水平,垂直],影响碰撞检测结果,避免相邻文本靠的太近
						// 		stroke: '#0ff', // 描边颜色
						// 		strokeWidth: 0.2, // 描边宽度
						// 		raisingHeight: 800000,
						// 		textAllowOverlap: true
						// 	});
						// scene.addLayer(textLayer);
						lineUp = new L7.LineLayer({ zIndex: 1 })
							.source(data)
							.shape('line')
							.color('#0DCCFF')
							.size(1)
							.style({
								raisingHeight: 800000
							});
						scene.addLayer(lineUp);

						const provincelayer = new L7.PolygonLayer({})
							.source(data)
							.size(800000)    // 切面高度
							.shape('extrude')
							.color('#0DCCFF')
							.active({
								color: 'rgb(100,230,255)'
							})
							.style({
								heightfixed: true,
								pickLight: true,
								raisingHeight: 0,  // 抬升高度,距离底图的高度
								opacity: 0.8
							});
						scene.addLayer(provincelayer);
						return '';
					});
				return '';
			});
			</script>
</body>
</html>
源码下载