Lightning Web Component: How to debug LWC
It is essential to debug your code, and the logic before moving to production or even it is beneficial to track and debug the value of an array or an object.
As we know to debug the code we use the console.log or alert in our code, but this is not a very handy way to debug the code or the logic.
Let’s configure the Debug Mode
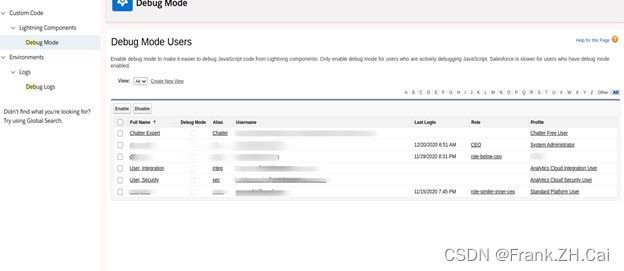
Debug mode for the user. Go to the setup and type the debug mode and click. you will get the list of users and select the user who wants to debug the code and enable the debugger.
-
Debug mode for the user. Go to the setup and type the debug mode and click. you will get the list of users and select the user who wants to debug the code and enable the debugger.
-
Debug mode for the user. Go to the setup and type the debug mode and click. you will get the list of users and select the user who wants to debug the code and enable the debugger.
<template>
   <lightning-card icon-name="standard:person_account" title="Imperative Apex Call">

       <lightning-layout horizontal-align="spread">
           <lightning-layout-item padding="around-medium">
               <lightning-button label="Salesforce Driller Show Accounts" onclick={onShowClickSalesforceDriller}></lightning-button>
           </lightning-layout-item>
          <lightning-layout-item padding="around-medium">
               <lightning-button label="Hide Accounts" onclick={onHideClickSalesforceDriller}></lightning-button>
           </lightning-layout-item>
       </lightning-layout>


       <lightning-layout multiple-rows="true">
           <template if:true={showAccounts}>
               <template for:each={accountsList} for:item="account">
                   <lightning-layout-item size="12" key={account.Id}>
                      <div class="slds-text-align_center">
                           {account.Name}
                       </div>
                   </lightning-layout-item>
               </template>
           </template>
       </lightning-layout>


   </lightning-card>
</template>
import { LightningElement,wire,track } from 'lwc';
import salesforcedrillergetAllActiveAccounts from '@salesforce/apex/accountclass.accountclass';
export default class salesforcedriller extends LightningElement {

   @track accountsList;
   @track showAccounts;

   onShowClickSalesforceDriller(){

       salesforcedrillergetAllActiveAccounts()
       .then(result => {
               this.accountsList = result;
               this.showAccounts = true;
       })
       .catch(error => {
           console.log('Errorured:- '+error.body.message);
       });
   }
   onHideClickSalesforceDriller(){
       this.showAccounts = false;
   }
}
Apex Class
public class accountclass {
    @AuraEnabled (cacheable=true)
    public static List accountclass() {
        List acc=[select id,name from Account limit 5];
        return acc;
    }
}
Let’s Debug the code
As we can see in the JS file we are getting all the account record and assign them to accountsList. We will keep monitoring whether the data is captured in this decorator or not.
Follow the below steps to debug:
- For that, we need to move to the chrome browser and run your
component. - Right-click and select the inspect
Let us breakdown every step
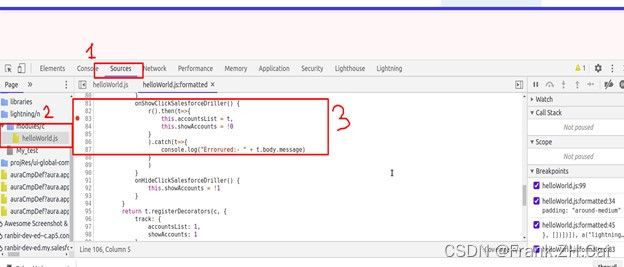
1. Step-1 You can see the source tab on the panel click on that
2. On Step-2 right-hand side you have to go to the module section and click on the js file that is your component file.
3. On Step-3 you can see your method name which is calling the apex classes. As you can see on the left side we have the breakpoint that will stop the execution. It is very simple just click the line number and it will pause the execution.
- Now it’s time to execute our method. Just click on the button salesforce driller show account and you will notice the execution will break and you can see the result without printing the console log in the browser.
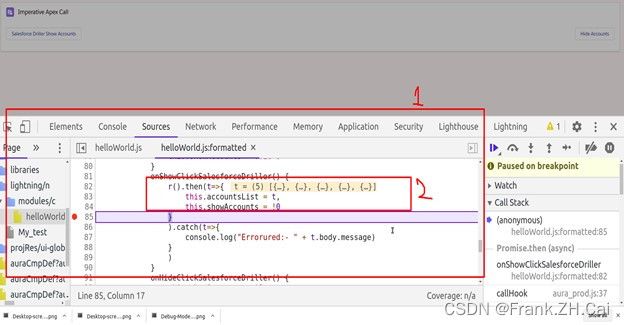
After executing the code you can see the execution stops on the particular line and in the Second marker you will be seeing all the results set on mouseover that result.
This way we can easily figure out the Data points and the flow of our logic.