RTMPose关键点检测实战——笔记3
文章目录
- 摘要
- 安装MMPose
-
- 安装虚拟环境
- 安装pytorch
- 安装MMCV
- 安装其他的安装包
- 下载 MMPose
- 下载预训练模型权重文件和视频素材
- 安装MMDetection
-
- 安装Pytorch
- 安装MMCV
- 安装其它工具包
- 下载 MMDetection
- 安装MMDetection
- 下载预训练模型权重文件和视频素材
- MMPose预训练模型预测
-
- 命令行的方式
- 代码的方式
- 三角板目标检测
-
- 下载数据集
- 训练
- 评估
- 可视化训练日志
-
- 导出训练日志表格
- 训练集损失函数可视化
- 训练集准确率可视化
- 测试集评估指标-MS COCO Metric 可视化
- 测试集评估指标-PASCAL VOC Metric可视化
- 模型轻量化转换
- 预测
- 关键点检测
-
- 下载配置文件
- 训练
- 可视化训练日志
-
- 训练集损失函数可视化
- 训练集准确率可视化
- 测试集评估指标-NME可视化
- 模型权重文件精简转换
- 下载训练好的模型权重
- 单张图片预测
- 视频预测
-
- 错误
- python代码预测单张图片
摘要
今天,学习RTMPose关键点检测实战。教大家如何安装安装MMDetection和MMPose。
实战项目以三角板关键点检测场景为例,结合OpenMMLab开源目标检测算法库MMDetection、开源关键点检测算法库MMPose、开源模型部署算法库MMDeploy,全面讲解项目全流程:
-
数据集:Labelme标注数据集、整理标注格式至MS COCO
-
目标检测:分别训练Faster R CNN和RTMDet-Tiny目标检测模型、训练日志可视化、测试集评估、对图像、摄像头画面预测
-
关键点检测:训练RTMPose-S关键点检测模型、训练日志可视化、测试集上评估、分别对“图像、视频、摄像头画面”预测
-
模型终端部署:转ONNX格式,终端推理
视频链接:
1、安装MMDetection和MMPose:https://www.bilibili.com/video/BV1Pa4y1g7N7
2、MMDetection三角板目标检测:https://www.bilibili.com/video/BV1Lm4y1879K
3、MMPose、RTMPose三角板关键点检测:https://www.bilibili.com/video/BV12a4y1u7sd
讲师是张子豪 OpenMMLab算法工程师。
保姆级代码教程: github.com/TommyZihao/MMPose_Tutorials。
教程讲的非常详细。

没想到,子豪兄也是小黑子。
安装MMPose
安装虚拟环境
教程没有新建虚拟环境,我建议大家安装的时候,新建虚拟环境,执行命令:
conda create --name mymm python=3.7

然后,会安装一些必要的安装包。等待安装完成即可。
安装完成后,激活虚拟环境,执行命令:
ubuntu执行命令:
conda activate mymm
Windows环境执行命令:
activate mymm
如果是Windows环境,无法激活虚拟环境参考:
https://blog.csdn.net/hhhhhhhhhhwwwwwwwwww/article/details/120514255
安装pytorch
安装pytorch,要结合自己的硬件和Cuda版本。比如我的CUDA版本是11.3的,需要寻找支持11.3版本的pytorch。

打开网站:https://pytorch.org/,选择历史版本。
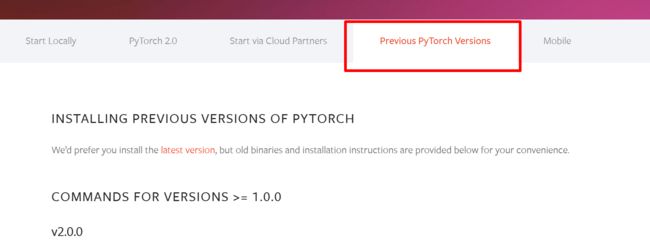
V1.12.1版本有11.3的版本,就选他了。

执行命令:
conda install pytorch==1.12.1 torchvision==0.13.1 torchaudio==0.12.1 cudatoolkit=11.3 -c pytorch

安装MMCV
使用openmim安装mmengine、mmcv和mmdet,执行命令:
pip install -U openmim
mim install mmengine
mim install 'mmcv==2.0.0rc3'
mim install "mmdet>=3.0.0rc6"
安装其他的安装包
pip install opencv-python pillow matplotlib seaborn tqdm pycocotools -i https://pypi.tuna.tsinghua.edu.cn/simple
下载 MMPose
使用git下载MMPose代码,Windows需要单独安装git命令,链接:https://git-scm.com/download/win。
安装完成后执行Git命令:
git clone https://github.com/open-mmlab/mmpose.git -b tutorial2023
下载代码。
然后使用Pycharm打开。
安装必要的包,执行命令:
mim install -e .
检查环境配置,首先检查pytorch,执行代码:
# 检查 Pytorch
import torch, torchvision
print('Pytorch 版本', torch.__version__)
print('CUDA 是否可用',torch.cuda.is_available())
检查mmcv:
# 检查 mmcv
import mmcv
from mmcv.ops import get_compiling_cuda_version, get_compiler_version
print('MMCV版本', mmcv.__version__)
print('CUDA版本', get_compiling_cuda_version())
print('编译器版本', get_compiler_version())

检查mmpose:
# 检查 mmpose
import mmpose
print('mmpose版本', mmpose.__version__)

一切OK!!!
下载预训练模型权重文件和视频素材
创建文件夹,执行代码:
import os

# 创建 checkpoint 文件夹,用于存放预训练模型权重文件
os.mkdir('checkpoint')

# 创建 outputs 文件夹,用于存放预测结果
os.mkdir('outputs')

# 创建 data 文件夹,用于存放图片和视频素材
os.mkdir('data')

os.mkdir('data/test')
然后下载素材:
# 多人图片,来源:https://www.pexels.com/zh-cn/photo/2168292/
!wget https://zihao-openmmlab.obs.cn-east-3.myhuaweicloud.com/20220610-mmpose/images/multi-person.jpeg -O data/test/multi-person.jpeg

# 单人视频-唱跳篮球
!wget https://zihao-openmmlab.obs.myhuaweicloud.com/20220610-mmpose/videos/cxk.mp4 -P data/test

# 妈妈和女儿跳舞,经微信压缩
!wget https://zihao-openmmlab.obs.myhuaweicloud.com/20220610-mmpose/videos/mother_wx.mp4 -P data/test

# 两个女生跳舞视频,来源:https://mixkit.co/free-stock-video/two-girls-having-fun-in-a-retro-restaurant-42298/
!wget https://zihao-openmmlab.obs.cn-east-3.myhuaweicloud.com/20220610-mmpose/videos/two-girls.mp4 -O data/test/two-girls.mp4

安装MMDetection
安装Pytorch
同上
安装MMCV
同上
安装其它工具包
同上
下载 MMDetection
git clone https://github.com/open-mmlab/mmdetection.git -b 3.x

安装MMDetection
进入MMDetection的根目录,执行命令:
pip install -v -e .
安装MMDetection。

检查,pytorch,代码如下:
# 检查 Pytorch
import torch, torchvision
print('Pytorch 版本', torch.__version__)
print('CUDA 是否可用',torch.cuda.is_available())
检查MMCV,代码如下:
# 检查 mmcv
import mmcv
from mmcv.ops import get_compiling_cuda_version, get_compiler_version
print('MMCV版本', mmcv.__version__)
print('CUDA版本', get_compiling_cuda_version())
print('编译器版本', get_compiler_version())
检查MMDetection,代码如下:
# 检查 mmpose
import mmdet
print('mmdetection版本', mmdet.__version__)
下载预训练模型权重文件和视频素材
import os

# 创建 checkpoint 文件夹,用于存放预训练模型权重文件
os.mkdir('checkpoint')

# 创建 outputs 文件夹,用于存放预测结果
os.mkdir('outputs')

# 创建 data 文件夹,用于存放图片和视频素材
os.mkdir('data')
MMPose预训练模型预测
命令行的方式
HRNet预测单张图像
python demo/topdown_demo_with_mmdet.py \
        demo/mmdetection_cfg/faster_rcnn_r50_fpn_coco.py \
        https://download.openmmlab.com/mmdetection/v2.0/faster_rcnn/faster_rcnn_r50_fpn_1x_coco/faster_rcnn_r50_fpn_1x_coco_20200130-047c8118.pth \
        configs/body_2d_keypoint/topdown_heatmap/coco/td-hm_hrnet-w32_8xb64-210e_coco-256x192.py \
        https://download.openmmlab.com/mmpose/top_down/hrnet/hrnet_w32_coco_256x192-c78dce93_20200708.pth \
        --input data/test/multi-person.jpeg \
        --output-root outputs/B1_HRNet_1 \
        --device cuda:0 \
        --bbox-thr 0.5 \
        --kpt-thr 0.2 \
        --nms-thr 0.3 \
        --radius 8 \
        --thickness 4 \
        --draw-bbox \
        --draw-heatmap \
        --show-kpt-idx
RTMPose预测单张图像
python demo/topdown_demo_with_mmdet.py \
        demo/mmdetection_cfg/faster_rcnn_r50_fpn_coco.py \
        https://download.openmmlab.com/mmdetection/v2.0/faster_rcnn/faster_rcnn_r50_fpn_1x_coco/faster_rcnn_r50_fpn_1x_coco_20200130-047c8118.pth \
        projects/rtmpose/rtmpose/body_2d_keypoint/rtmpose-s_8xb256-420e_coco-256x192.py \
        https://download.openmmlab.com/mmpose/v1/projects/rtmpose/rtmpose-s_simcc-aic-coco_pt-aic-coco_420e-256x192-fcb2599b_20230126.pth \
        --input data/test/multi-person.jpeg \
        --output-root outputs/B1_RTM_1 \
        --device cuda:0 \
        --bbox-thr 0.5 \
        --kpt-thr 0.5 \
        --nms-thr 0.3 \
        --radius 8 \
        --thickness 4 \
        --draw-bbox \
        --draw-heatmap \
        --show-kpt-idx
预测视频:直接将–input换成视频路径即可
python demo/topdown_demo_with_mmdet.py \
        demo/mmdetection_cfg/faster_rcnn_r50_fpn_coco.py \
        https://download.openmmlab.com/mmdetection/v2.0/faster_rcnn/faster_rcnn_r50_fpn_1x_coco/faster_rcnn_r50_fpn_1x_coco_20200130-047c8118.pth \
        configs/body_2d_keypoint/topdown_heatmap/coco/td-hm_hrnet-w32_8xb64-210e_coco-256x192.py \
        https://download.openmmlab.com/mmpose/top_down/hrnet/hrnet_w32_coco_256x192-c78dce93_20200708.pth \
        --input data/test/mother_wx.mp4 \
        --output-root outputs/B1_HRNet_2 \
        --device cuda:0 \
        --bbox-thr 0.5 \
        --kpt-thr 0.2 \
        --nms-thr 0.3 \
        --radius 5 \
        --thickness 2 \
        --draw-bbox \
        --draw-heatmap \
        --show-kpt-idx
代码的方式
在MMPose的根目录,新建test.py,运行下面的代码:
import cv2
import numpy as np
from PIL import Image

import matplotlib.pyplot as plt


import torch

import mmcv
from mmcv import imread
import mmengine
from mmengine.registry import init_default_scope

from mmpose.apis import inference_topdown
from mmpose.apis import init_model as init_pose_estimator
from mmpose.evaluation.functional import nms
from mmpose.registry import VISUALIZERS
from mmpose.structures import merge_data_samples

from mmdet.apis import inference_detector, init_detector

# 有 GPU 就用 GPU,没有就用 CPU
device = torch.device('cuda:0' if torch.cuda.is_available() else 'cpu')
print('device', device)

img_path = 'data/test/multi-person.jpeg'

# Faster R CNN
detector = init_detector(
    'demo/mmdetection_cfg/faster_rcnn_r50_fpn_coco.py',
    'https://download.openmmlab.com/mmdetection/v2.0/faster_rcnn/faster_rcnn_r50_fpn_1x_coco/faster_rcnn_r50_fpn_1x_coco_20200130-047c8118.pth',
    device=device
)

pose_estimator = init_pose_estimator(
    'configs/body_2d_keypoint/topdown_heatmap/coco/td-hm_hrnet-w32_8xb64-210e_coco-256x192.py',
    'https://download.openmmlab.com/mmpose/top_down/hrnet/hrnet_w32_coco_256x192-c78dce93_20200708.pth',
    device=device,
    cfg_options={'model': {'test_cfg': {'output_heatmaps': True}}}
)

init_default_scope(detector.cfg.get('default_scope', 'mmdet'))

# 获取目标检测预测结果
detect_result = inference_detector(detector, img_path)
print(detect_result.keys())

# 预测类别
print(detect_result.pred_instances.labels)
# 置信度
print(detect_result.pred_instances.scores)

# 置信度阈值
CONF_THRES = 0.5

pred_instance = detect_result.pred_instances.cpu().numpy()
bboxes = np.concatenate((pred_instance.bboxes, pred_instance.scores[:, None]), axis=1)
bboxes = bboxes[np.logical_and(pred_instance.labels == 0, pred_instance.scores > CONF_THRES)]
bboxes = bboxes[nms(bboxes, 0.3)][:, :4]
print(bboxes)

# 获取每个 bbox 的关键点预测结果
pose_results = inference_topdown(pose_estimator, img_path, bboxes)

print(len(pose_results))

# 把多个bbox的pose结果打包到一起
data_samples = merge_data_samples(pose_results)

print(data_samples.keys())
# 每个人 17个关键点 坐标
print(data_samples.pred_instances.keypoints.shape)

# 索引为 0 的人,每个关键点的坐标
print(data_samples.pred_instances.keypoints[0,:,:])

# 每一类关键点的预测热力图
print(data_samples.pred_fields.heatmaps.shape)
idx_point = 13
heatmap = data_samples.pred_fields.heatmaps[idx_point,:,:]
print(heatmap.shape)
# 索引为 idx 的关键点,在全图上的预测热力图
plt.imshow(heatmap)
plt.show()

# 半径
pose_estimator.cfg.visualizer.radius = 10
# 线宽
pose_estimator.cfg.visualizer.line_width = 8
visualizer = VISUALIZERS.build(pose_estimator.cfg.visualizer)
# 元数据
visualizer.set_dataset_meta(pose_estimator.dataset_meta)

img = mmcv.imread(img_path)
img = mmcv.imconvert(img, 'bgr', 'rgb')

img_output = visualizer.add_datasample(
            'result',
            img,
            data_sample=data_samples,
            draw_gt=False,
            draw_heatmap=True,
            draw_bbox=True,
            show_kpt_idx=True,
            show=False,
            wait_time=0,
            out_file='outputs/B2.jpg'
)
print(img_output.shape)

plt.figure(figsize=(10,10))
plt.imshow(img_output)
plt.show()
中间运行结果:

热力图:

展示可视化效果:
三角板目标检测
下载数据集
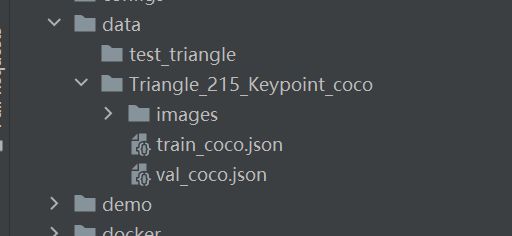
数据集链接:https://zihao-download.obs.cn-east-3.myhuaweicloud.com/yolov8/datasets/Triangle_215_Dataset/Triangle_215_Keypoint_coco.zip
下载到data中,然后解压。
下载测试图片和视频
https://zihao-openmmlab.obs.myhuaweicloud.com/20220610-mmpose/triangle_dataset/test_img/triangle_1.jpg
https://zihao-openmmlab.obs.myhuaweicloud.com/20220610-mmpose/triangle_dataset/test_img/triangle_2.jpg
https://zihao-openmmlab.obs.myhuaweicloud.com/20220610-mmpose/triangle_dataset/test_img/triangle_3.jpg
https://zihao-openmmlab.obs.myhuaweicloud.com/20220610-mmpose/triangle_dataset/test_img/triangle_4.jpg
https://zihao-openmmlab.obs.myhuaweicloud.com/20220610-mmpose/triangle_dataset/videos/triangle_6.mp4
https://zihao-openmmlab.obs.myhuaweicloud.com/20220610-mmpose/triangle_dataset/videos/triangle_7.mp4
https://zihao-openmmlab.obs.myhuaweicloud.com/20220610-mmpose/triangle_dataset/videos/triangle_9.mp4
将图片和视频存放到data/test_triangle

在mmpose和mmdetection都存放上述的数据集
训练
下载config文件,链接:
https://zihao-openmmlab.obs.myhuaweicloud.com/20220610-mmpose/triangle_dataset/faster_r_cnn_triangle.py
https://zihao-openmmlab.obs.myhuaweicloud.com/20220610-mmpose/triangle_dataset/rtmdet_tiny_triangle.py
将上面的文件下载下来,然后,在mmpose和mmdetection的data文件夹里都存放一份。
在mmdetection目录下运行:
python tools/train.py data/faster_r_cnn_triangle.py
或者:
python tools/train.py data/rtmdet_tiny_triangle.py
如果,显存比较小可以选择运行rtmdet_tiny_triangle.py

等待训练完成!

最终的训练结果!
评估
运行命令:
python tools/test.py data/rtmdet_tiny_triangle.py work_dirs/rtmdet_tiny_triangle/epoch_200.pth
即可评估模型。

上图是测评结果
可视化训练日志
训练模型时在work_dirs目录生成记录训练日志,解析其中损失函数、评估指标等信息,并可视化。
导出训练日志表格
import pandas as pd
from tqdm import tqdm

import matplotlib.pyplot as plt

plt.rcParams['axes.unicode_minus']=False  # 用来正常显示负号

# 日志文件路径
log_path = 'work_dirs/rtmdet_tiny_triangle/20230605_233335/vis_data/scalars.json'

with open(log_path, "r") as f:
    json_list = f.readlines()

print(len(json_list))
print(eval(json_list[4]))
df_train = pd.DataFrame()
df_test = pd.DataFrame()
for each in tqdm(json_list):
    if 'coco/bbox_mAP' in each:
        df_test = df_test.append(eval(each), ignore_index=True)
    else:
        df_train = df_train.append(eval(each), ignore_index=True)
print(df_train)
print(df_test)
df_train.to_csv('训练日志-训练集.csv', index=False)
df_test.to_csv('训练日志-测试集.csv', index=False)
训练集损失函数可视化
from matplotlib import colors as mcolors
import random
random.seed(124)
colors = ['b', 'g', 'r', 'c', 'm', 'y', 'k', 'tab:blue', 'tab:orange', 'tab:green', 'tab:red', 'tab:purple', 'tab:brown', 'tab:pink', 'tab:gray', 'tab:olive', 'tab:cyan', 'black', 'indianred', 'brown', 'firebrick', 'maroon', 'darkred', 'red', 'sienna', 'chocolate', 'yellow', 'olivedrab', 'yellowgreen', 'darkolivegreen', 'forestgreen', 'limegreen', 'darkgreen', 'green', 'lime', 'seagreen', 'mediumseagreen', 'darkslategray', 'darkslategrey', 'teal', 'darkcyan', 'dodgerblue', 'navy', 'darkblue', 'mediumblue', 'blue', 'slateblue', 'darkslateblue', 'mediumslateblue', 'mediumpurple', 'rebeccapurple', 'blueviolet', 'indigo', 'darkorchid', 'darkviolet', 'mediumorchid', 'purple', 'darkmagenta', 'fuchsia', 'magenta', 'orchid', 'mediumvioletred', 'deeppink', 'hotpink']
markers = [".",",","o","v","^","<",">","1","2","3","4","8","s","p","P","*","h","H","+","x","X","D","d","|","_",0,1,2,3,4,5,6,7,8,9,10,11]
linestyle = ['--', '-.', '-']

def get_line_arg():
    '''
    随机产生一种绘图线型
    '''
    line_arg = {}
    line_arg['color'] = random.choice(colors)
    # line_arg['marker'] = random.choice(markers)
    line_arg['linestyle'] = random.choice(linestyle)
    line_arg['linewidth'] = random.randint(1, 4)
    # line_arg['markersize'] = random.randint(3, 5)
    return line_arg

metrics = ['loss', 'loss_bbox', 'loss_cls', 'loss_rpn_cls', 'loss_rpn_bbox']

plt.figure(figsize=(16, 8))

x = df_train['step']
for y in metrics:
    plt.plot(x, df_train[y], label=y, **get_line_arg())

plt.tick_params(labelsize=20)
plt.xlabel('step', fontsize=20)
plt.ylabel('loss', fontsize=20)
plt.title('训练集损失函数', fontsize=25)
plt.savefig('训练集损失函数.pdf', dpi=120, bbox_inches='tight')

plt.legend(fontsize=20)

plt.show()

训练集准确率可视化
metrics = ['acc']

plt.figure(figsize=(16, 8))

x = df_train['step']
for y in metrics:
    plt.plot(x, df_train[y], label=y, **get_line_arg())

plt.tick_params(labelsize=20)
plt.xlabel('step', fontsize=20)
plt.ylabel('loss', fontsize=20)
plt.title('训练集准确率', fontsize=25)
plt.savefig('训练集准确率.pdf', dpi=120, bbox_inches='tight')

plt.legend(fontsize=20)

plt.show()
测试集评估指标-MS COCO Metric 可视化
metrics = ['coco/bbox_mAP', 'coco/bbox_mAP_50', 'coco/bbox_mAP_75', 'coco/bbox_mAP_s', 'coco/bbox_mAP_m', 'coco/bbox_mAP_l']

plt.figure(figsize=(16, 8))

x = df_test['step']
for y in metrics:
    plt.plot(x, df_test[y], label=y, **get_line_arg())

plt.tick_params(labelsize=20)
# plt.ylim([0, 100])
plt.xlabel('Epoch', fontsize=20)
plt.ylabel(y, fontsize=20)
plt.title('测试集评估指标', fontsize=25)
plt.savefig('测试集分类评估指标.pdf', dpi=120, bbox_inches='tight')
plt.legend(fontsize=20)
plt.show()
测试集评估指标-PASCAL VOC Metric可视化
metrics = ['pascal_voc/mAP', 'pascal_voc/AP50']
plt.figure(figsize=(16, 8))
x = df_test['step']
for y in metrics:
    plt.plot(x, df_test[y], label=y, **get_line_arg())
plt.tick_params(labelsize=20)
# plt.ylim([0, 100])
plt.xlabel('Epoch', fontsize=20)
plt.ylabel(y, fontsize=20)
plt.title('测试集评估指标', fontsize=25)
plt.savefig('测试集分类评估指标.pdf', dpi=120, bbox_inches='tight')

plt.legend(fontsize=20)

plt.show()
模型轻量化转换
python tools/model_converters/publish_model.py work_dirs/faster_r_cnn_triangle/epoch_50.pth checkpoint/faster_r_cnn_triangle_epoch_50_202305120846.pth
或者
python tools/model_converters/publish_model.py work_dirs/rtmdet_tiny_triangle/epoch_200.pth checkpoint/rtmdet_tiny_triangle_epoch_200_202305120847.pth
预测
将上面的模型训练完成后,就可以看是预测了。如果显卡不给力,跑的时间太长,也可以使用训练好的模型预测,下载链接:
https://zihao-openmmlab.obs.cn-east-3.myhuaweicloud.com/20220610-mmpose/triangle_dataset/ckpt/0512/faster_r_cnn_triangle_epoch_50_202305120846-76d9dde3.pth
https://zihao-openmmlab.obs.cn-east-3.myhuaweicloud.com/20220610-mmpose/triangle_dataset/ckpt/0512/rtmdet_tiny_triangle_epoch_200_202305120847-3cd02a8f.pth
然后,将其分别放在mmpose和mmdetection的checkpoint文件夹里面
测试单张图像,执行预测命令:
python demo/image_demo.py data/test_triangle/triangle_3.jpg data/faster_r_cnn_triangle.py --weights checkpoint/faster_r_cnn_triangle_epoch_50_202305120846-76d9dde3.pth --out-dir outputs/E2_faster_r_cnn --device cuda:0 --pred-score-thr 0.3

测试视频,执行命令:
python demo/video_demo.py data/test_triangle/triangle_9.mp4 data/faster_r_cnn_triangle.py checkpoint/faster_r_cnn_triangle_epoch_50_202305120846-76d9dde3.pth --device cuda:0 --score-thr 0.96 --out outputs/E2_out_video_faster_r_cnn.mp4

关键点检测
下载配置文件
链接如下:
https://zihao-openmmlab.obs.cn-east-3.myhuaweicloud.com/20220610-mmpose/triangle_dataset/rtmpose-s-triangle.py
将脚本放大mmpose的data文件夹。
训练
在命令行里执行:
python tools/train.py data/rtmpose-s-triangle.py
开始训练

可视化训练日志
导出训练日志
import pandas as pd
from tqdm import tqdm

import matplotlib.pyplot as plt
%matplotlib inline
plt.rcParams['axes.unicode_minus']=False  # 用来正常显示负号
# 日志文件路径
log_path = 'work_dirs/rtmpose-s-triangle/20230512_091723/vis_data/scalars.json'

with open(log_path, "r") as f:
    json_list = f.readlines()
df_train = pd.DataFrame()
df_test = pd.DataFrame()
for each in tqdm(json_list):
    if 'coco/AP' in each:
        df_test = df_test.append(eval(each), ignore_index=True)
    else:
        df_train = df_train.append(eval(each), ignore_index=True)

df_train.to_csv('训练日志-训练集.csv', index=False)
df_test.to_csv('训练日志-测试集.csv', index=False)
训练集损失函数可视化
from matplotlib import colors as mcolors
import random
random.seed(124)
colors = ['b', 'g', 'r', 'c', 'm', 'y', 'k', 'tab:blue', 'tab:orange', 'tab:green', 'tab:red', 'tab:purple', 'tab:brown', 'tab:pink', 'tab:gray', 'tab:olive', 'tab:cyan', 'black', 'indianred', 'brown', 'firebrick', 'maroon', 'darkred', 'red', 'sienna', 'chocolate', 'yellow', 'olivedrab', 'yellowgreen', 'darkolivegreen', 'forestgreen', 'limegreen', 'darkgreen', 'green', 'lime', 'seagreen', 'mediumseagreen', 'darkslategray', 'darkslategrey', 'teal', 'darkcyan', 'dodgerblue', 'navy', 'darkblue', 'mediumblue', 'blue', 'slateblue', 'darkslateblue', 'mediumslateblue', 'mediumpurple', 'rebeccapurple', 'blueviolet', 'indigo', 'darkorchid', 'darkviolet', 'mediumorchid', 'purple', 'darkmagenta', 'fuchsia', 'magenta', 'orchid', 'mediumvioletred', 'deeppink', 'hotpink']
markers = [".",",","o","v","^","<",">","1","2","3","4","8","s","p","P","*","h","H","+","x","X","D","d","|","_",0,1,2,3,4,5,6,7,8,9,10,11]
linestyle = ['--', '-.', '-']

def get_line_arg():
    '''
    随机产生一种绘图线型
    '''
    line_arg = {}
    line_arg['color'] = random.choice(colors)
    # line_arg['marker'] = random.choice(markers)
    line_arg['linestyle'] = random.choice(linestyle)
    line_arg['linewidth'] = random.randint(1, 4)
    # line_arg['markersize'] = random.randint(3, 5)
    return line_arg
metrics = ['loss', 'loss_kpt']

plt.figure(figsize=(16, 8))

x = df_train['step']
for y in metrics:
    plt.plot(x, df_train[y], label=y, **get_line_arg())

plt.tick_params(labelsize=20)
plt.xlabel('step', fontsize=20)
plt.ylabel('loss', fontsize=20)
plt.title('训练集损失函数', fontsize=25)
plt.savefig('训练集损失函数.pdf', dpi=120, bbox_inches='tight')

plt.legend(fontsize=20)

plt.show()
训练集准确率可视化
metrics = ['coco/AP', 'coco/AP .5', 'coco/AP .75', 'coco/AP (M)', 'coco/AP (L)', 'coco/AR', 'coco/AR .5', 'coco/AR .75', 'coco/AR (M)', 'coco/AR (L)', 'PCK', 'AUC']
plt.figure(figsize=(16, 8))

x = df_test['step']
for y in metrics:
    plt.plot(x, df_test[y], label=y, **get_line_arg())

plt.tick_params(labelsize=20)
# plt.ylim([0, 100])
plt.xlabel('Epoch', fontsize=20)
plt.ylabel(y, fontsize=20)
plt.title('测试集评估指标', fontsize=25)
plt.savefig('测试集分类评估指标.pdf', dpi=120, bbox_inches='tight')

plt.legend(fontsize=20)

plt.show()
测试集评估指标-NME可视化
metrics = ['NME']
plt.figure(figsize=(16, 8))

x = df_test['step']
for y in metrics:
    plt.plot(x, df_test[y], label=y, **get_line_arg())

plt.tick_params(labelsize=20)
# plt.ylim([0, 100])
plt.xlabel('Epoch', fontsize=20)
plt.ylabel(y, fontsize=20)
plt.title('测试集评估指标', fontsize=25)
plt.savefig('测试集分类评估指标.pdf', dpi=120, bbox_inches='tight')

plt.legend(fontsize=20)
plt.show()
模型权重文件精简转换
python tools/misc/publish_model.py \
        work_dirs/rtmpose-s-triangle/epoch_300.pth \
        checkpoint/rtmpose_s_triangle_300.pth
下载训练好的模型权重
如果训练时间太长,可以先使用官方的权重文件做测试,链接如下:
https://zihao-openmmlab.obs.cn-east-3.myhuaweicloud.com/20220610-mmpose/triangle_dataset/ckpt/0512/rtmpose_s_triangle_300-34bfaeb2_20230512.pth
下载完成后,将其复制到mmpose的 checkpoint文件夹
单张图片预测
python demo/topdown_demo_with_mmdet.py data/faster_r_cnn_triangle.py checkpoint/faster_r_cnn_triangle_epoch_50_202305120846-76d9dde3.pth data/rtmpose-s-triangle.py checkpoint/rtmpose_s_triangle_300-34bfaeb2_20230512.pth --input data/test_triangle/triangle_4.jpg --output-root outputs/G2_Fasterrcnn-RTMPose --device cuda:0 --bbox-thr 0.5 --kpt-thr 0.5 --nms-thr 0.3 --radius 36 --thickness 30 --draw-bbox --draw-heatmap --show-kpt-idx
视频预测
python demo/topdown_demo_with_mmdet.py data/rtmdet_tiny_triangle.py checkpoint/rtmdet_tiny_triangle_epoch_200_202305120847-3cd02a8f.pth data/rtmpose-s-triangle.py checkpoint/rtmpose_s_triangle_300-34bfaeb2_20230512.pth --input data/test_triangle/triangle_9.mp4 --output-root outputs/G2_Video --device cuda:0 --bbox-thr 0.5 --kpt-thr 0.5 --nms-thr 0.3 --radius 16 --thickness 10 --draw-bbox --draw-heatmap --show-kpt-idx
错误
cv2.error: OpenCV(4.7.0) D:\a\opencv-python\opencv-python\opencv\modules\highgui\src\window.cpp:1338: error: (-2:Unspecified error) The function is not implemented. Rebuild the library with Windows, GTK+ 2.x or Cocoa support. If you are on Ubuntu or Debian, install libgtk2.0-dev and pkg-config, then re-run cmake or configure script in function 'cvWaitKey'
解决方法:

将这一行注释掉
python代码预测单张图片
import cv2
import numpy as np
from PIL import Image
import matplotlib.pyplot as plt
import torch
import mmcv
from mmcv import imread
import mmengine
from mmengine.registry import init_default_scope
from mmpose.apis import inference_topdown
from mmpose.apis import init_model as init_pose_estimator
from mmpose.evaluation.functional import nms
from mmpose.registry import VISUALIZERS
from mmpose.structures import merge_data_samples
from mmdet.apis import inference_detector, init_detector
# 有 GPU 就用 GPU,没有就用 CPU
device = torch.device('cuda:0' if torch.cuda.is_available() else 'cpu')
print('device', device)
img_path = 'data/test_triangle/triangle_4.jpg'
# Faster R CNN 三角板目标检测
detector = init_detector(
'data/faster_r_cnn_triangle.py',
'checkpoint/faster_r_cnn_triangle_epoch_50_202305120846-76d9dde3.pth',
device=device
)
pose_estimator = init_pose_estimator(
'data/rtmpose-s-triangle.py',
'checkpoint/rtmpose_s_triangle_300-34bfaeb2_20230512.pth',
device=device,
cfg_options={'model': {'test_cfg': {'output_heatmaps': True}}}
)
init_default_scope(detector.cfg.get('default_scope', 'mmdet'))
# 获取目标检测预测结果
detect_result = inference_detector(detector, img_path)
print(detect_result.keys())
print(detect_result.pred_instances.labels)
# 置信度
print(detect_result.pred_instances.scores)
# 置信度阈值
CONF_THRES = 0.5
pred_instance = detect_result.pred_instances.cpu().numpy()
bboxes = np.concatenate((pred_instance.bboxes, pred_instance.scores[:, None]), axis=1)
bboxes = bboxes[np.logical_and(pred_instance.labels == 0, pred_instance.scores > CONF_THRES)]
bboxes = bboxes[nms(bboxes, 0.3)][:, :4].astype('int')
# 获取每个 bbox 的关键点预测结果
pose_results = inference_topdown(pose_estimator, img_path, bboxes)
print(len(pose_results))
# 把多个bbox的pose结果打包到一起
data_samples = merge_data_samples(pose_results)
keypoints = data_samples.pred_instances.keypoints.astype('int')
# 每一类关键点的预测热力图
print(data_samples.pred_fields.heatmaps.shape)
kpt_idx = 1
heatmap = data_samples.pred_fields.heatmaps[kpt_idx,:,:]
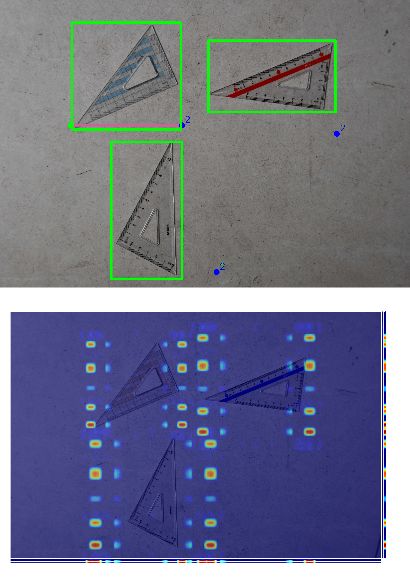
# 索引为 idx 的关键点,在全图上的预测热力图
plt.imshow(heatmap)
plt.show()
img_bgr = cv2.imread(img_path)
# 检测框的颜色
bbox_color = (150,0,0)
# 检测框的线宽
bbox_thickness = 20
# 关键点半径
kpt_radius = 70
# 连接线宽
skeleton_thickness = 30
# 三角板关键点检测数据集-元数据(直接从config配置文件中粘贴)
dataset_info = {
'keypoint_info':{
0:{'name':'angle_30','id':0,'color':[255,0,0],'type': '','swap': ''},
1:{'name':'angle_60','id':1,'color':[0,255,0],'type': '','swap': ''},
2:{'name':'angle_90','id':2,'color':[0,0,255],'type': '','swap': ''}
},
'skeleton_info': {
0: {'link':('angle_30','angle_60'),'id': 0,'color': [100,150,200]},
1: {'link':('angle_60','angle_90'),'id': 1,'color': [200,100,150]},
2: {'link':('angle_90','angle_30'),'id': 2,'color': [150,120,100]}
}
}
# 关键点类别和关键点ID的映射字典
label2id = {}
for each in dataset_info['keypoint_info'].items():
label2id[each[1]['name']] = each[0]
for bbox_idx, bbox in enumerate(bboxes): # 遍历每个检测框
# 画框
img_bgr = cv2.rectangle(img_bgr, (bbox[0], bbox[1]), (bbox[2], bbox[3]), bbox_color, bbox_thickness)
# 索引为 0 的框,每个关键点的坐标
keypoints = data_samples.pred_instances.keypoints[bbox_idx, :, :].astype('int')
# 画连线
for skeleton_id, skeleton in dataset_info['skeleton_info'].items(): # 遍历每一种连接
skeleton_color = skeleton['color']
srt_kpt_id = label2id[skeleton['link'][0]] # 起始点的类别 ID
srt_kpt_xy = keypoints[srt_kpt_id] # 起始点的 XY 坐标
dst_kpt_id = label2id[skeleton['link'][1]] # 终止点的类别 ID
dst_kpt_xy = keypoints[dst_kpt_id] # 终止点的 XY 坐标
img_bgr = cv2.line(img_bgr, (srt_kpt_xy[0], srt_kpt_xy[1]), (dst_kpt_xy[0], dst_kpt_xy[1]),
color=skeleton_color, thickness=skeleton_thickness)
# 画关键点
for kpt_idx, kpt_xy in enumerate(keypoints): # 遍历该检测框中的每一个关键点
kpt_color = dataset_info['keypoint_info'][kpt_idx]['color']
img_bgr = cv2.circle(img_bgr, (kpt_xy[0], kpt_xy[1]), kpt_radius, kpt_color, -1)
plt.imshow(img_bgr[:,:,::-1])
plt.show()
cv2.imwrite('outputs/G3_opencv.jpg', img_bgr)
# 半径
pose_estimator.cfg.visualizer.radius = 50
# 线宽
pose_estimator.cfg.visualizer.line_width = 20
visualizer = VISUALIZERS.build(pose_estimator.cfg.visualizer)
# 元数据
visualizer.set_dataset_meta(pose_estimator.dataset_meta)
img = mmcv.imread(img_path)
img = mmcv.imconvert(img, 'bgr', 'rgb')
img_output = visualizer.add_datasample(
'result',
img,
data_sample=data_samples,
draw_gt=False,
draw_heatmap=True,
draw_bbox=True,
show=False,
show_kpt_idx=True,
wait_time=0,
out_file='outputs/G3_visualizer.jpg',
kpt_thr=0.3
)
plt.figure(figsize=(10, 10))
plt.imshow(img_output)
plt.show()


