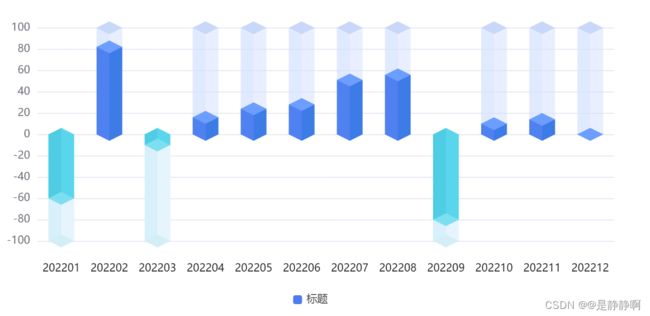
echarts立体柱状图,正负极不同颜色的设置
文章目录
- 效果图
- 代码
效果图
代码
<template>
<div
ref="bar_3d"
class="echarts"
:id="indData_id"
style="width: 50%; height: 22rem"
></div>
</template>
<script>
import * as echarts from "echarts";
// import { handleQfNumberStr } from "@/utils/QfNumberStr";
export default {
data() {
return {
axis: [],
value: [],
observer: null,
};
},
props: {
//表格数据
incAxis: {
type: Array,
default: () => [
[
"202201",
"202202",
"202203",
"202204",
"202205",
"202206",
"202207",
"202208",
"202209",
"202210",
"202211",
"202212",
],
[-60, 82, -10, 16, 24, 28, 51, 55.8, -80, 10, 14, 0],
],
},
//表格id
indData_id: {
type: String,
default: "echarts3D",
},
//表格标题
title: {
type: String,
default: "标题",
},
//单位
indicatorUnit: {
type: String,
default: "元",
},
//横坐标是否倾斜
isrotate: {
type: Boolean,
default: false,
},
},
watch: {
incAxis: {
handler(newVal) {
this.init(newVal);
},
immediate: true, // 首次加载时执行监听
deep: true, // 值改变时执行监听
},
},
mounted() {
this.init(this.incAxis);
},
methods: {
init(newVal) {
if (newVal.length === 2) {
this.axis = newVal[0];
this.value = newVal[1];
this.initEchart(this.axis, this.value);
} else {
this.initEchart(newVal, "");
}
},
//立体柱状图
getEcharts3DBar(xAxisData, data, _this) {
var colorArr = [];
var colorArrdown = [];
var shadowArr = [];
var shadowArrdown = [];
let backArr = [];
let floatArr = [];
let floatArrdown = [];
// 遍历data找到最大值赋予特殊符号
// debugger
let yMax = 100;
var maxVal = Math.max.apply(
Math,
data.map((e) => {
return Math.abs(e);
})
);
if (maxVal < 1) {
// 最大值小于1 设置阴影1
yMax = 1;
} else if (maxVal < 10) {
// 最大值小于10 设置阴影10
yMax = 10;
} else if (maxVal < 50) {
// 最大值小于50 设置阴影50
yMax = 50;
} else if (maxVal < 100) {
// 最大值小于100 设置阴影100
yMax = 100;
} else {
// 最大值大于100 按前两位数+1取整计算阴影
let maxvalue = Number(`${Math.ceil(maxVal)}`.slice(0, 2)) + 1;
let i = `${Math.ceil(maxVal)}`.length - 2;
for (let e = 0; e < i; e++) {
maxvalue = maxvalue * 10;
}
yMax = maxvalue;
}
for (let i = 0; i < data.length; i++) {
let ymax = yMax;
if (data[i] >= 0) {
ymax = yMax;
} else {
ymax = -yMax;
}
backArr.push(ymax);
}
// 立体柱状图三面颜色
colorArr = [
"rgba(80, 129, 241, 1)",
"rgba(61, 123, 231, 1)",
"rgba(108, 158, 255, 1)",
];
colorArrdown = [
"RGBA(78, 205, 228, 1)",
"RGBA(90, 214, 236, 1)",
"RGBA(124, 223, 240, 1)",
];
shadowArr = [
"rgba(212, 225, 255, 0.70)",
"rgba(211, 223, 253, 0.50)",
"rgba(200, 216, 249, 1)",
];
shadowArrdown = [
"RGBA(216, 240, 251, 1)",
"RGBA(230, 244, 253, 1)",
"RGBA(212, 238, 248, 1)",
];
floatArr = [
"rgba(86, 145, 255, 1)",
"rgba(134, 171, 255, 1)",
"rgba(110, 163, 255, 1)",
"rgba(161, 189, 255, 1)",
];
floatArrdown = [
"RGBA(78, 205, 228, .8)",
"RGBA(90, 214, 236, .6)",
"RGBA(124, 223, 240, .8)",
"RGBA(78, 205, 228, .5)",
];
var color = {
type: "linear",
x: 0,
x2: 1,
y: 0,
y2: 0,
colorStops: [
{
offset: 0,
color: colorArr[0],
},
{
offset: 0.5,
color: colorArr[0],
},
{
offset: 0.5,
color: colorArr[1],
},
{
offset: 1,
color: colorArr[1],
},
],
};
var colorDown = {
type: "linear",
x: 0,
x2: 1,
y: 0,
y2: 0,
colorStops: [
{
offset: 0,
color: colorArrdown[0],
},
{
offset: 0.5,
color: colorArrdown[0],
},
{
offset: 0.5,
color: colorArrdown[1],
},
{
offset: 1,
color: colorArrdown[1],
},
],
};
var shadow = {
type: "linear",
x: 0,
x2: 1,
y: 0,
y2: 0,
colorStops: [
{ offset: 0, color: shadowArr[0] },
{ offset: 0.5, color: shadowArr[0] },
{ offset: 0.5, color: shadowArr[1] },
{ offset: 1, color: shadowArr[1] },
],
};
var shadowDown = {
type: "linear",
x: 0,
x2: 1,
y: 0,
y2: 0,
colorStops: [
{ offset: 0, color: shadowArrdown[0] },
{ offset: 0.5, color: shadowArrdown[0] },
{ offset: 0.5, color: shadowArrdown[1] },
{ offset: 1, color: shadowArrdown[1] },
],
};
// 悬浮高亮颜色
var float = {
type: "linear",
x: 0,
x2: 1,
y: 0,
y2: 0,
colorStops: [
{ offset: 0, color: floatArr[1] },
{ offset: 0.5, color: floatArr[1] },
{ offset: 0.5, color: floatArr[3] },
{ offset: 1, color: floatArr[3] },
],
};
// 悬浮高亮颜色
var floatDown = {
type: "linear",
x: 0,
x2: 1,
y: 0,
y2: 0,
colorStops: [
{ offset: 0, color: floatArrdown[1] },
{ offset: 0.5, color: floatArrdown[1] },
{ offset: 0.5, color: floatArrdown[3] },
{ offset: 1, color: floatArrdown[3] },
],
};
// 不同类目的柱间距
var barWidth = 29;
var constData = [];
var showData = [];
data?.filter(function (item) {
if (item != null) {
constData.push(item);
showData.push(item);
} else {
constData.push(0);
showData.push({
value: 1,
itemStyle: {
normal: {
borderColor: "rgba(0,0,0,0)",
borderWidth: 2,
color: "rgba(0,0,0,0)",
},
},
});
}
});
function showGrid() {
let object = {
left: "2%", //图表距边框的距离
right: "2%",
top: "10%",
bottom: _this.isrotate ? "15px" : "40px",
containLabel: true,
};
return object;
}
function showLegend() {
let object = {
selectedMode: false,
bottom: "0",
data: [_this.title],
// color: "#5081F1",
itemWidth: 10,
itemHeight: 10,
itemStyle: {
color: "#4C7CEE",
},
};
return object;
}
return {
tooltip: {
trigger: "axis",
backgroundColor: "rgba(0,0,0,0.55)",
boxShadow: "3px 3px 9px 0px rgba(106,106,106,0.3)",
backdropFilter: "blur(4px)",
borderWidth: 0,
className: "tooltips-box",
textStyle: {
fontSize: "12",
color: "#ffffff",
},
axisPointer: {
type: "shadow",
shadowStyle: {
opacity: 0,
},
},
// 鼠标悬浮显示的数据样式
formatter: function (params) {
var str = params[1].axisValue;
// params.filter(function (item) {
// if (item.componentSubType == "bar") {
if (_this.indicatorUnit === "户") {
str +=
"
" +
params[1].seriesName +
" " +
`${
params[1].value != null
? params[1].value
: "--"
}` +
_this.indicatorUnit;
} else {
str +=
"
" +
params[1].seriesName +
" " +
`${
params[1].value != null
? params[1].value
: "--"
}` +
_this.indicatorUnit;
}
// }
// });
return str;
},
textStyle: {
color: "#fff",
fontStyle: "normal",
fontWeight: "normal",
fontFamily: "sans-serif",
fontSize: 14,
},
},
legend: showLegend(),
grid: showGrid(),
// x轴的坐标
xAxis: {
axisLine: {
show: false, //不显示坐标轴轴线
},
axisTick: {
show: false, //不显示坐标轴刻度
},
data: xAxisData,
axisLabel: {
show: true,
interval: 0,
color: "#232323",
margin: _this.isrotate ? 30 : 25,
rotate: _this.isrotate ? 30 : 0, //横坐标是否倾斜
align: "center",
},
type: "category",
},
yAxis: {
max: yMax,
interval: yMax / 5,
axisTick: {
show: false,
},
axisLine: {
show: false,
},
axisLabel: {
show: true,
},
},
series: [
// 背景阴影
{
z: 1,
name: _this.title,
type: "bar",
barWidth: barWidth,
data: backArr.map((item) => {
return {
value: item,
emphasis: {
itemStyle: {
color: item < 0 ? shadowDown : shadow,
},
},
};
}),
itemStyle: {
normal: {
color: (val) => {
var color_index = val.value;
return color_index < 0 ? shadowDown : shadow;
},
},
},
emphasis: {
itemStyle: {
// normal: {
// color: (val)=>{
// console.log(val);
// var color_index=val.value;
// return color_index<0?shadowDown: shadow;
// },
color: shadow,
// },
},
},
},
// {
// z: 2,
// name: _this.title,
// type: "pictorialBar",
// data: backArr,
// symbol: "diamond",
// symbolOffset: ["0%", "50%"],
// symbolSize: [barWidth, barWidth * 0.5],
// itemStyle: {
// normal: {
// color: (val)=>{
// var color_index=val.value;
// return color_index<0?shadowDown: shadow;
// },
// },
// },
// emphasis: {
// itemStyle: {
// color: (val)=>{
// var color_index=val.value;
// return color_index<0?shadowDown: shadow;
// },
// },
// },
// tooltip: {
// show: false,
// },
// barCategoryGap: "40",
// },
{
z: 3,
name: _this.title,
type: "pictorialBar",
symbolPosition: "end",
data: backArr.map((item) => {
return {
value: item,
symbolOffset: item < 0 ? [0, "50%"] : [0, "-50%"],
emphasis: {
itemStyle: {
color: item < 0 ? shadowDown : shadow,
},
},
};
}),
symbol: "diamond",
symbolOffset: [0, "-50%"],
symbolSize: [barWidth, barWidth * 0.5],
itemStyle: {
normal: {
color: (val) => {
var color_index = val.value;
return color_index < 0 ? shadowArrdown[2] : shadowArr[2];
},
},
},
// emphasis: {
// itemStyle: {
// color: (val) => {
// var color_index = val.value;
// return color_index < 0 ? shadowDown : shadow;
// },
// },
// },
tooltip: {
show: false,
},
barCategoryGap: "40",
},
// 三面数据
{
z: 1,
name: _this.title,
type: "bar",
barWidth: barWidth,
barGap: "-100%",
data: data.map((item) => {
return {
value: item,
emphasis: {
itemStyle: {
color: item < 0 ? floatDown : float,
},
},
};
}),
itemStyle: {
normal: {
color: (val) => {
var color_index = val.value;
return color_index < 0 ? colorDown : color;
},
},
},
// emphasis: {
// itemStyle: {
// color: float,
// },
// },
},
{
z: 2,
name: _this.title,
type: "pictorialBar",
data: constData.map((item) => {
return {
value: item,
symbolOffset: item < 0 ? [0, "-50%"] : [0, "50%"],
emphasis: {
itemStyle: {
color: item < 0 ? floatDown : float,
},
},
};
}),
symbol: "diamond",
symbolOffset: ["0%", "50%"],
symbolSize: [barWidth, barWidth * 0.5],
itemStyle: {
normal: {
color: (val) => {
var color_index = val.value;
return color_index < 0 ? colorDown : color;
},
},
},
// emphasis: {
// itemStyle: {
// color: float,
// },
// },
// tooltip: {
// show: false,
// },
barCategoryGap: "40",
},
{
z: 3,
name: _this.title,
type: "pictorialBar",
symbolPosition: "end",
data: showData.map((item) => {
return {
value: item,
symbolOffset: item < 0 ? [0, "50%"] : [0, "-50%"],
emphasis: {
itemStyle: {
color: item < 0 ? floatArrdown[2] : floatArr[2],
},
},
};
}),
symbol: "diamond",
symbolOffset: ["0%", "-50%"],
symbolSize: [barWidth, barWidth * 0.5],
itemStyle: {
normal: {
color: (val) => {
var color_index = val.value;
return color_index < 0 ? colorArrdown[2] : colorArr[2];
},
},
},
barCategoryGap: "40",
},
],
};
},
initEchart(axis, value) {
let _this = this;
this.$nextTick(() => {
let serveTBar = echarts.init(
document.getElementById(this.indData_id),
null,
{ devicePixelRatio: 2.5 }
);
// serveTBar.setOption(this.getEcharts3DBar(axis, value, _this));
// window.addEventListener("resize", function () {
// serveTBar.resize();
// });
serveTBar.setOption(this.getEcharts3DBar(axis, value, _this));
this.observer = new ResizeObserver((entries) => {
serveTBar.resize();
});
this.observer.observe(document.getElementById(this.indData_id));
});
},
},
destroyed() {
this.observer.disconnect();
},
};
</script>