数据可视化清新版【chart.js】学习笔记3.0—折线图(Line)
Line——(折线图/曲线图)
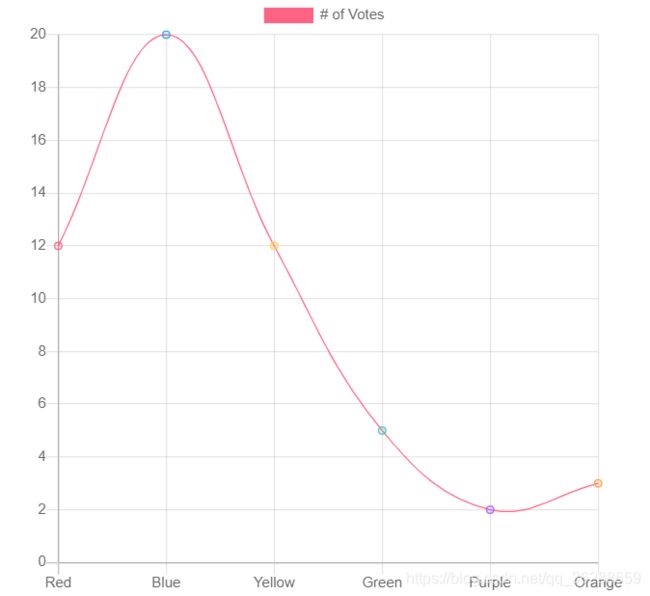
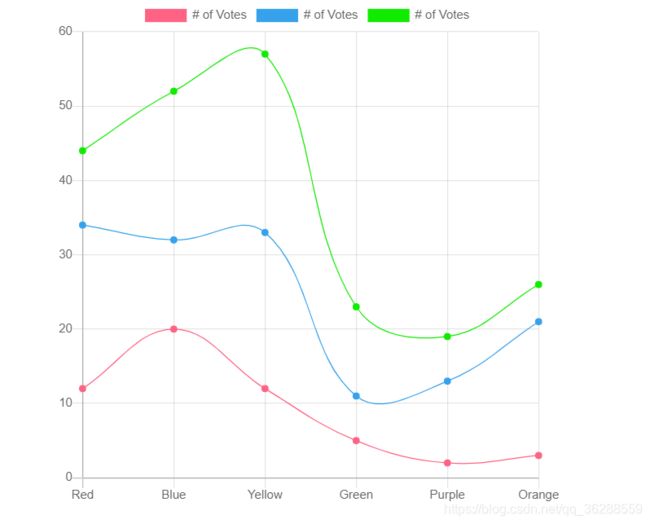
折线图是在一条线上绘制数据点的方法。通常,它用于显示趋势数据或两个数据集的比较。
官方文档https://www.chartjs.org/docs/latest/charts/line.html
用法示例
var myLineChart = new Chart(ctx, {
type: ‘line’,
data: data,
options: options
});
图表属性(博主这边只列举看出了比较常用和设置影响明显的属性)
| 属性 | 描述 | 类型 | 默认值 |
|---|---|---|---|
| label | 图例和工具提示中显示的数据集标签,表现为横坐标 | string | ‘’ |
| pointBackgroundColor | 点的填充颜色。 | Color | ‘rgba(0, 0, 0, 0.1)’ |
| pointBorderColor | 点的边框颜色。 | Color | ‘rgba(0, 0, 0, 0.1)’ |
| pointBorderWidth | 点边框的宽度(以像素为单位)。 | number | 1 |
| pointHitRadius | 对鼠标事件做出反应的未显示点的像素大小。 | number | 1 |
| pointRadius | 点形状的半径。如果设置为0,则不渲染该点。 | number | 1 |
| pointStyle | 点的样式 | string/Image | ‘circle’ |
| backgroundColor | 线条填充颜色。 | Color | ‘rgba(0, 0, 0, 0.1)’ |
| borderColor | 线条颜色。 | Color | ‘rgba(0, 0, 0, 0.1)’ |
| borderWidth | 线宽(以像素为单位)。 | number | 3 |
| fill | 填充线下区域方式。 | boolea/string | true |
| lineTension | 贝塞尔曲线的线张力。设置为0以绘制直线。 | number | 0.4 |
| showLine | 是否展示线条。 | boolean | true |
| spanGaps | 是否进行控制中断。 | boolean | undefined |
| pointHoverBackgroundColor | 悬停时点背景色。 | Color | undefined |
| pointHoverBorderColor | 悬停时点边框的颜色。 | Color | undefined |
| pointHoverBorderWidth | 悬停时点的边框宽度。 | number | 1 |
| pointHoverRadius | 悬停时点的半径。 | number | 1 |
| steppedLine | 阶梯线设置 | boolen/string | false |
相关属性详解
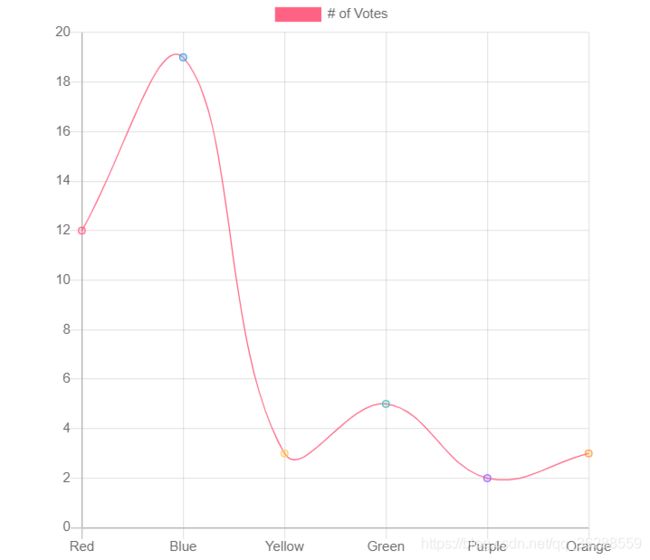
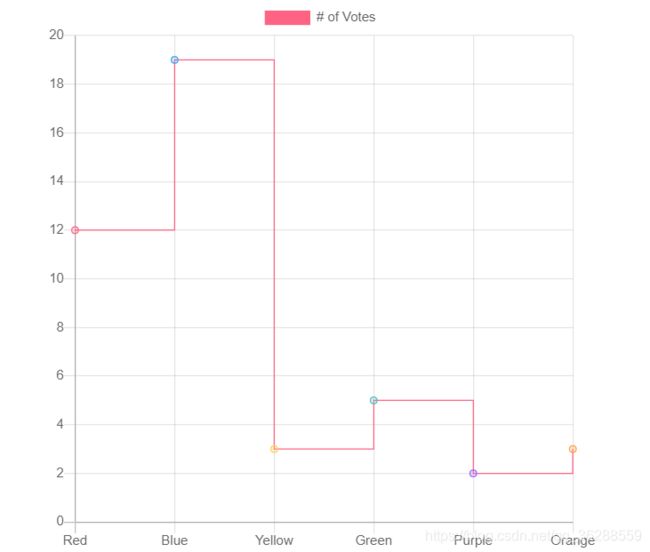
阶梯线steppedLine 支持以下值。 false:无步插值(默认), true:插值前的步长(eq。‘before’), ‘before’:插值前, ‘after’:后续插值, ‘middle’:中间步插值。 如果该steppedLine值设置为false以外的任何值,lineTension将被忽略。
let ctx = document.getElementById("myChart2");
let myChart = new Chart(ctx, {
    type: 'line',
    data: {
    labels: ['Red', 'Blue', 'Yellow', 'Green', 'Purple', 'Orange'],
    datasets: [{
      label: '# of Votes',
      fill:false,
      steppedLine:false,//默认false不设置也可以
      data: [12, 19, 3, 5, 2, 3],
      backgroundColor: [
          'rgba(255, 99, 132, 0.2)',
          'rgba(54, 162, 235, 0.2)',
          'rgba(255, 206, 86, 0.2)',
          'rgba(75, 192, 192, 0.2)',
          'rgba(153, 102, 255, 0.2)',
          'rgba(255, 159, 64, 0.2)'
      ],
      borderColor: [
           'rgba(255, 99, 132, 1)',
           'rgba(54, 162, 235, 1)',
           'rgba(255, 206, 86, 1)',
           'rgba(75, 192, 192, 1)',
           'rgba(153, 102, 255, 1)',
           'rgba(255, 159, 64, 1)'
      ],
      borderWidth: 1
    }]
 	},
    options: options,
});
let ctx = document.getElementById("myChart2");
let myChart = new Chart(ctx, {
    type: 'line',
    data: {
          labels: ['Red', 'Blue', 'Yellow', 'Green', 'Purple', 'Orange'],
          datasets: [{
             label: '# of Votes',
             fill:false,
             steppedLine:true,
             data: [12, 19, 3, 5, 2, 3],
             backgroundColor:backgroundColor,
             borderColor:borderColor,
             borderWidth: 1
         }]
    },
     options: options,
});
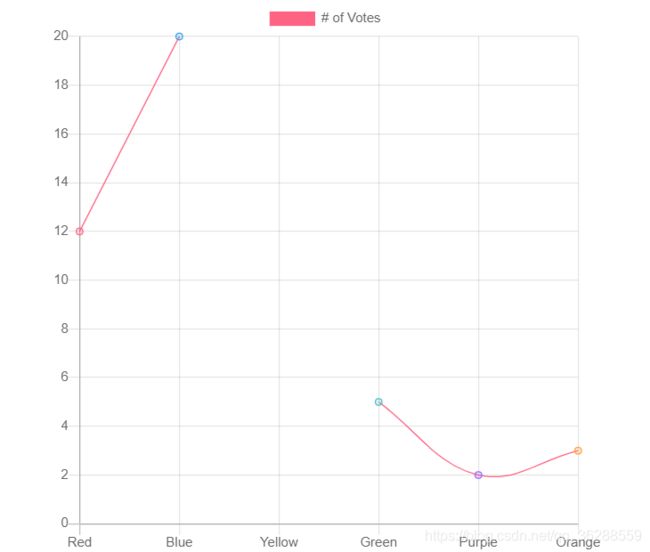
spanGaps 设置开启当数据中存在空值如undefined,null,NaN,’'是空值左右两点会进行连接,反之不开启,会出现断层。
let ctx = document.getElementById("myChart2");
let myChart = new Chart(ctx, {
    type: 'line',
    data: {
          labels: ['Red', 'Blue', 'Yellow', 'Green', 'Purple', 'Orange'],
          datasets: [{
             label: '# of Votes',
             fill:false,
             data: [12, 20, undefined, 5, 2, 3],
             spanGaps:false,//默认undefined和不开启效果一样
             backgroundColor:backgroundColor,
             backgroundColor:backgroundColor,
             borderColor:borderColor,
             borderWidth: 1
         }]
    },
    options: options,
});
let ctx = document.getElementById("myChart2");
let myChart = new Chart(ctx, {
    type: 'line',
    data: {
          labels: ['Red', 'Blue', 'Yellow', 'Green', 'Purple', 'Orange'],
          datasets: [{
             label: '# of Votes',
             fill:false,
             data: [12, 20, undefined, 5, 2, 3],
             spanGaps:true,
             backgroundColor:backgroundColor,
             backgroundColor:backgroundColor,
             borderColor:borderColor,
             borderWidth: 1
         }]
    },
    options: options,
});
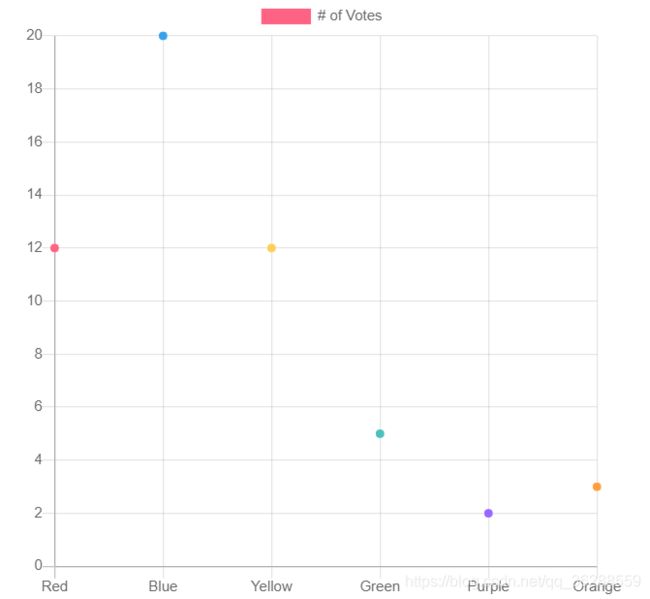
showLine 设置开启则线条可见,反之关闭线条不可见
let ctx = document.getElementById("myChart2");
let myChart = new Chart(ctx, {
    type: 'line',
    data: {
          labels: ['Red', 'Blue', 'Yellow', 'Green', 'Purple', 'Orange'],
          datasets: [{
             label: '# of Votes',
             fill:false,
             showLine:true,
             data: [12, 20, 12, 5, 2, 3],
             backgroundColor:backgroundColor,
             backgroundColor:backgroundColor,
             borderColor:borderColor,
             borderWidth: 1
         }]
    },
    options: options,
});
let ctx = document.getElementById("myChart2");
let myChart = new Chart(ctx, {
    type: 'line',
    data: {
          labels: ['Red', 'Blue', 'Yellow', 'Green', 'Purple', 'Orange'],
          datasets: [{
             label: '# of Votes',
             fill:false,
             showLine:false,
             data: [12, 20, 12, 5, 2, 3],
             backgroundColor:backgroundColor,
             backgroundColor:backgroundColor,
             borderColor:borderColor,
             borderWidth: 1
         }]
    },
    options: options,
});
lineTension 贝塞尔曲线的线张力。设置为0以绘制直线。如果使用单调三次插值,则忽略此选项。可以通过它开设置是折线图还是曲线图
let ctx = document.getElementById("myChart2");
let myChart = new Chart(ctx, {
    type: 'line',
    data: {
          labels: ['Red', 'Blue', 'Yellow', 'Green', 'Purple', 'Orange'],
          datasets: [{
             label: '# of Votes',
             fill:false,
             lineTension:0,//设置为0展示为折线
             data: [12, 20, 12, 5, 2, 3],
             backgroundColor:backgroundColor,
             backgroundColor:backgroundColor,
             borderColor:borderColor,
             borderWidth: 1
         }]
    },
    options: options,
});
let ctx = document.getElementById("myChart2");
let myChart = new Chart(ctx, {
    type: 'line',
    data: {
          labels: ['Red', 'Blue', 'Yellow', 'Green', 'Purple', 'Orange'],
          datasets: [{
             label: '# of Votes',
             fill:false,
             lineTension:0.4,//默认0.4为曲线
             data: [12, 20, 12, 5, 2, 3],
             backgroundColor:backgroundColor,
             backgroundColor:backgroundColor,
             borderColor:borderColor,
             borderWidth: 1
         }]
    },
    options: options,
});
fill 区域填充方式
let ctx = document.getElementById("myChart2");
let myChart = new Chart(ctx, {
    type: 'line',
    data: {
          labels: ['Red', 'Blue', 'Yellow', 'Green', 'Purple', 'Orange'],
          datasets: [{
             label: '# of Votes',
             fill:false,
             data: [12, 20, 12, 5, 2, 3],
             backgroundColor:backgroundColor,
             backgroundColor:backgroundColor,
             borderColor:borderColor,
             borderWidth: 1
         }]
    },
    options: options,
});
let ctx = document.getElementById("myChart2");
let myChart = new Chart(ctx, {
    type: 'line',
    data: {
          labels: ['Red', 'Blue', 'Yellow', 'Green', 'Purple', 'Orange'],
          datasets: [{
             label: '# of Votes',
             fill:true,//默认填充,不设置也可以
             data: [12, 20, 12, 5, 2, 3],
             backgroundColor:backgroundColor,
             backgroundColor:backgroundColor,
             borderColor:borderColor,
             borderWidth: 1
         }]
    },
    options: options,
});
其他
高性能折线图
绘制大量数据时,图表渲染时间可能会开始变得相当长。在这种情况下,可以使用以下策略来提高性能。
- 数据抽取
- 禁用贝塞尔曲线
- 不渲染线条
- 禁用动画
详见:https://chartjs.bootcss.com/docs/charts/line.html#fill
拓展
let ctx = document.getElementById("myChart2");
let myChart = new Chart(ctx, {
	type: 'line',
    data: {
          labels: ['Red', 'Blue', 'Yellow', 'Green', 'Purple', 'Orange'],
          datasets: [{//红线
                    label: '# of Votes',
                    fill:false,
                    showLine:true,
                    data: [12, 20, 12, 5, 2, 3],
                    backgroundColor:backgroundColor1,
                    borderColor: borderColor1,
                    borderWidth: 1
                    },
                    {//蓝线
                    label: '# of Votes',
                    fill:false,
                    showLine:true,
                    data: [22, 12, 21, 6, 11, 18],
                    backgroundColor:backgroundColor2,
                    borderColor: borderColor2,
                    borderWidth: 1
                    },
                    {//绿线
                    label: '# of Votes',
                    fill:false,
                    showLine:true,
                    data: [10, 20, 24, 12, 6, 5],
                    backgroundColor:backgroundColor3,
                    borderColor: borderColor3,
                    borderWidth: 1
                    }],
         },
  options: options
});
let ctx = document.getElementById("myChart2");
let myChart = new Chart(ctx, {
	type: 'line',
    data: {
          labels: ['Red', 'Blue', 'Yellow', 'Green', 'Purple', 'Orange'],
          datasets: [{//红线
                    label: '# of Votes',
                    fill:false,
                    showLine:true,
                    data: [12, 20, 12, 5, 2, 3],
                    backgroundColor:backgroundColor1,
                    borderColor: borderColor1,
                    borderWidth: 1
                    },
                    {//蓝线
                    label: '# of Votes',
                    fill:false,
                    showLine:true,
                    data: [22, 12, 21, 6, 11, 18],
                    backgroundColor:backgroundColor2,
                    borderColor: borderColor2,
                    borderWidth: 1
                    },
                    {//绿线
                    label: '# of Votes',
                    fill:false,
                    showLine:true,
                    data: [10, 20, 24, 12, 6, 5],
                    backgroundColor:backgroundColor3,
                    borderColor: borderColor3,
                    borderWidth: 1
                    }],
         },
  options: {
         scales: {
               yAxes: [{
                    ticks: {
                         beginAtZero: true
                    },
                    stacked: true,
               }],
               xAxes: [{
                    ticks: {
                         beginAtZero: true
                    },
                    stacked: true,
               }]
         }
  }
});
数据可视化清新版【chart.js】学习笔记
01.数据可视化清新版【chart.js】学习笔记1.0—介绍
02.数据可视化清新版【chart.js】学习笔记2.0—项目引入
03.数据可视化清新版【chart.js】学习笔记3.0—折线图(Line)
04.数据可视化清新版【chart.js】学习笔记4.0—柱状图(Bar)
05.数据可视化清新版【chart.js】学习笔记5.0—雷达图(Radar)
06.数据可视化清新版【chart.js】学习笔记6.0—饼图(Pie)
07.数据可视化清新版【chart.js】学习笔记7.0—环形图(Doughnut )
08.数据可视化清新版【chart.js】学习笔记8.0—极地图(Polar Area)
09.数据可视化清新版【chart.js】学习笔记9.0—气泡图(Bubble Chart)
10.数据可视化清新版【chart.js】学习笔记10.0—离散图(Scatter Chart)
11.数据可视化清新版【chart.js】学习笔记11.0—混合图表
12.数据可视化清新版【chart.js】学习笔记12.0—面积图表
13.数据可视化清新版【chart.js】学习笔记13.0—图表配置
14.数据可视化清新版【chart.js】学习笔记14.0—数据更新

