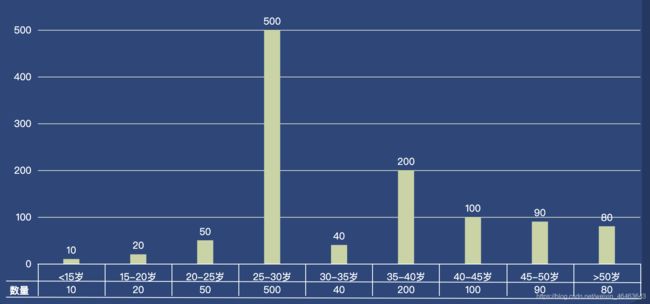
<script>
import 'echarts/lib/chart/bar'
var data = {
title: [
'<15岁',
'15-20岁',
'20-25岁',
'25-30岁',
'30-35岁',
'35-40岁',
'40-45岁',
'45-50岁',
'>50岁'
],
plan_production: [10, 20, 50, 500, 40, 200, 100, 90, 80]
}
function getTableLine(num) {
const list = []
const bottom = 26
const height = 20
for (var i = 0; i < num; i++) {
list.push({
type: 'line',
bottom: bottom - i * height,
right: 0,
style: {
fill: '#fff',
stroke: '#fff'
},
shape: {
x1: 10,
y1: 0,
x2: 799,
y2: 2
}
})
}
return list
}
var lineList = getTableLine(3)
export default {
data() {
return {
options: {
color: '#c7d4a1',
title: [
{
text: '\n数量',
bottom: 12,
left: 20,
textStyle: {
color: '#fff',
lineHeight: 0,
fontSize: 12
}
}
],
tooltip: {
trigger: 'axis',
axisPointer: {
type: 'cross',
label: {
backgroundColor: '#283b56'
}
}
},
grid: {
bottom: 50,
left: 60,
right: 2
},
xAxis: [
{
type: 'category',
boundaryGap: true,
data: data.title,
axisTick: {
length: 40
},
axisLine: {
lineStyle: {
color: '#fff'
}
},
axisLabel: {
interval: 0,
axisPointer: {
type: 'shadow'
},
formatter: function (value, index) {
var indexNum = 0
for (var i = 0; i < data.title.length; i++) {
if (value === data.title[i]) {
indexNum = i
}
}
return (
'{table|' +
value +
'}\n{table|' +
data.plan_production[indexNum] +
'}\n{table|' +
'}'
)
},
rich: {
table: {
lineHeight: 16,
align: 'center'
}
}
}
}
],
yAxis: [
{
show: true,
type: 'value',
scale: false,
minInterval: 1,
axisLine: {
show: false,
lineStyle: {
color: '#fff'
}
},
axisTick: {
show: false
},
splitLine: {
show: true,
color: '#333'
},
min: function (v) {
return 0
}
}
],
series: [
{
name: '人数',
type: 'bar',
barWidth: '20px',
label: {
show: true,
position: 'top',
color: '#fff'
},
yAxisIndex: 0,
data: data.plan_production
}
],
graphic: lineList
}
}
}
}
</script>
