echarts 文本标签配置 label文字样式
字体基本样式设置:fontStyle、fontWeight、fontSize、fontFamily。
文字颜色:color。
文字描边:textBorderColor、textBorderWidth。
文字阴影:textShadowColor、textShadowBlur、textShadowOffsetX、textShadowOffsetY。
文本块或文本片段大小:lineHeight、width、height、padding。
文本块或文本片段的对齐:align、verticalAlign。
文本块或文本片段的边框、背景(颜色或图片):backgroundColor、borderColor、borderWidth、borderRadius。
文本块或文本片段的阴影:shadowColor、shadowBlur、shadowOffsetX、shadowOffsetY。
文本块的位置和旋转:position、distance、rotate。
echarts坐标轴的name属性更改位置
		name: 'name',
        nameTextStyle: {
            padding: [0, 0, 0, -10]    // 四个数字分别为上右下左与原位置距离
        }
echarts 柱状图鼠标划过的样式 划出之后恢复原样式
series: [
          {
            name: '人数',
            type: 'bar',
            barWidth: '12px', // 柱子宽度
            yAxisIndex: 0,
            itemStyle: {
            // normal是柱状图的正常样式
              normal: { // 渐变色设置
                color: new echarts.graphic.LinearGradient(
                  0,
                  1,
                  0,
                  0,
                  [
                    {
                      offset: 0,
                      color: '#4796FF' // 0% 处的颜色
                    },
                    {
                      offset: 1,
                      color: '#6BD1FF' // 100% 处的颜色
                    }
                  ],
                  false
                )
              },
               // 移入当前的柱状图时改变颜色
              emphasis: {
                color: new echarts.graphic.LinearGradient(
                  0,
                  1,
                  0,
                  0,
                  [
                    {
                      offset: 0,
                      color: '#FF8A4D' // 0% 处的颜色
                    },
                    {
                      offset: 1,
                      color: '#FFC82C' // 100% 处的颜色
                    }
                  ],
                  false
                )
              }
            },
            data: data.plan_production
          }
        ]
饼图的渐变颜色设置 位置设置

 series: [
          {
            name: '占比统计',
            type: 'pie',
            center: ['55%', '50%'], // 图列的位置Ï
            radius: [25, 90],
            itemStyle: {
              // 鼠标划过样式
              emphasis: {
                shadowBlur: 10,
                shadowOffsetX: 0,
                shadowColor: 'rgba(0, 0, 0, 0.5)'
              },
              // 颜色设置
              normal: {
                color: function (params) {
                  var colorList = [
                    {
                      c1: ' #12B7FF',
                      c2: '#058DE9'
                    },
                    {
                      c1: '#26D79C',
                      c2: '#0FB67F'
                    },
                    {
                      c1: '#1287FF',
                      c2: '#2261D5'
                    },
                    {
                      c1: '#FF8A4D',
                      c2: '#FFC82C'
                    },
                    {
                      c1: '#12ECFF',
                      c2: '#22D5CB'
                    }
                  ]
                  return new echarts.graphic.LinearGradient(1, 0, 0, 0, [
                    {
                      // 颜色渐变函数 前四个参数分别表示四个位置依次为左、下、右、上
                      offset: 0,
                      color: colorList[params.dataIndex].c1
                    },
                    {
                      offset: 1,
                      color: colorList[params.dataIndex].c2
                    }
                  ])
                }
              }
            },

            roseType: 'radius',
            label: {
              show: false
            },
            data: [
              { value: 24, name: '工作发现' },
              { value: 22, name: '上级交办' },
              { value: 18, name: '预警监测' },
              { value: 16, name: '群众举报' },
              { value: 14, name: '部门移送' }
            ]
          }
        ]
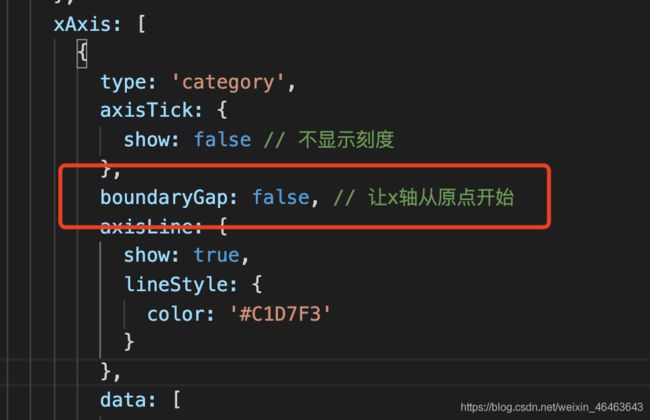
让x轴从原点开始