数据挖掘项目:金融银行风控信用评分卡模型(下篇)
以下是银行信用评分卡建模分析下篇的内容,包括采用两种方法进行数据分箱,然后构建模型,进行模型评估,最后评分卡建立这四部分。其中如果有一些地方分析的不正确,希望大家多多指正!
上篇文章链接数据挖掘项目:金融银行风控信用评分卡模型(上篇)
首先在分箱之前分训练集和测试集。
3 分训练集和测试集
from sklearn.model_selection import train_test_split
X = pd.DataFrame(X)
y = pd.DataFrame(y)

X_train,X_vali,Y_train,Y_vali = train_test_split(X,y,test_size = 0.3,random_state = 420)
model_data = pd.concat([Y_train,X_train],axis = 1)这样合并出来的数据序号是有问题的,所以对数据序号进行重新排列
model_data.index = range(model_data.shape[0])
model_data.columns = data.columns
## 测试集
vali_data = pd.concat([Y_vali,X_vali],axis = 1)
vali_data.index = range(vali_data.shape[0])
vali_data.columns = data.columns4.1使用toad数据分箱
有监督分箱:主要为卡方分箱和Split分箱等。
无监督分箱:等宽分箱,等频分箱,聚类分箱等
| IV | 特征对预测函数的贡献 |
| <0.03 |
特征几乎不带有效信息,对模型没有贡献,这种特征可以被删除
|
| 0.03~0.09 |
有效信息很少,对模型的贡献度低
|
| 0.1~0.29 |
有效信息一般,对模型的贡献度中等
|
| 0.3~0.49 |
有效信息较多,对模型的贡献度较高
|
| >=0.5 |
有效信息非常多,对模型的贡献超高并且可疑
|
使用toad库
## 首先对特征进行特征筛选,删除IV值小于0.02,并且相关性大于0.7的特征
import toad
train_selected, dropped = toad.selection.select(data,target = 'SeriousDlqin2yrs', empty = 0.5, iv = 0.02, corr = 0.7, return_drop=True, exclude=[])
print(train_selected.shape)
(149165, 12) 可以看出没有被删除的特征
# WOE编码
combiner = toad.transform.Combiner()
# 训练数据并指定分箱方法

combiner.fit(pd.concat([Y_train,X_train], axis=1), y='SeriousDlqin2yrs',method= 'chi',min_samples = 0.05,exclude=[])

train_adj = combiner.transform(pd.concat([Y_train,X_train], axis=1))
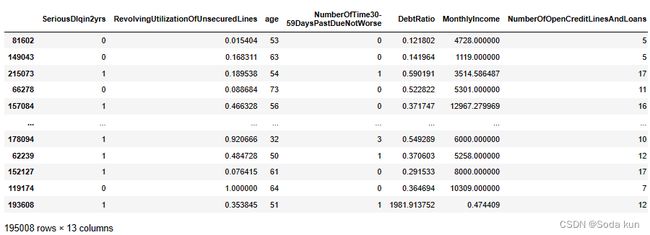
使用toad这个库进行分库时间用了很久,因为之前为解决数据不平衡我对数据使用了SMOTE算法,训练集有195008行,12列。
# 以字典形式保存分箱结果

bins = combiner. Export()

bins
可以看出使用toad的分箱,他的有些结果很奇怪。比如Revol中0.99999还要单独分出来,60-89天逾期特征只分了一箱等等,使用toad帮我们分好的箱子检查一下woe单调性,之后再结合业务知识手动调整。
分完箱之后计算woe(检查单调性)
hand_bins = {k:[-np.inf,*v[:-1],v[-1],np.inf] for k,v in bins.items()}
hand_bins
{'RevolvingUtilizationOfUnsecuredLines': [-inf,
0.018440045386342675,
0.06852667745187024,
0.1290432099118924,
0.2144586087447884,
0.38627962705315877,
0.5328138193520311,
0.656326274,
0.8503623774409887,
0.9999999,
1.0000010703936246,
inf],
'age': [-inf, 32, 48, 56, 62, 67, inf],
'NumberOfTime30-59DaysPastDueNotWorse': [-inf, 1, 2, inf],
'DebtRatio': [-inf,
0.01766888871568842,
0.228461723,
0.3461397165584121,
0.49366896039377894,
4.0,
687.0,
inf],
'MonthlyIncome': [-inf, 0.1700048060224203, 4.01, 3500.0, 6666.0, inf],
'NumberOfOpenCreditLinesAndLoans': [-inf, 2, 4, 6, 16, inf],
'NumberOfTimes90DaysLate': [-inf, 1, 2, inf],
'NumberRealEstateLoansOrLines': [-inf, 1, 2, 3, inf],
'NumberOfTime60-89DaysPastDueNotWorse': [-inf, 1, inf],
'NumberOfDependents': [-inf,
2.7529910995083284e-05,
1.0,
1.000024025755783,
2.0,
2.0001575076033538,
inf],
'AllNumlate': [-inf, 1, 2, 3, 4, inf],
'Monthlypayment': [-inf,
68.08847371534014,
452.9572370997398,
1398.494762096,
4030.8573442785505,
6037.739018665425,
inf]}
##包装一个函数进行计算
def get_woe(df,col,y,bins):
    df = df[[col,y]].copy()
    df["cut"] = pd.cut(df[col],bins)
    bins_df = df.groupby("cut")[y].value_counts().unstack()
    woe = bins_df["woe"] = np.log((bins_df[0]/bins_df[0].sum())/(bins_df[1]/bins_df[1].sum()))
    return woe
#将所有特征的WOE存储到字典当中
woeall = {}
for col in hand_bins:
    woeall[col] = get_woe(model_data,col,"SeriousDlqin2yrs",hand_bins[col])
woeall ##打印出结果{'RevolvingUtilizationOfUnsecuredLines': cut
(-inf, 0.01844] 2.710653
(0.01844, 0.0685267] 2.111032
(0.0685267, 0.129043] 1.373071
(0.129043, 0.214459] 0.824140
(0.214459, 0.38628] 0.191690
(0.38628, 0.532814] -0.372415
(0.532814, 0.656326] -0.799821
(0.656326, 0.850362] -1.156019
(0.850362, 1.0] -0.989479
(1.0, 1.000001] -0.186157
(1.000001, inf] -2.046859
dtype: float64,
'age': cut
(-inf, 32.0] -0.310471
(32.0, 48.0] -0.458418
(48.0, 56.0] -0.162071
(56.0, 62.0] 0.448978
(62.0, 67.0] 1.075670
(67.0, inf] 1.710243
dtype: float64,
'NumberOfTime30-59DaysPastDueNotWorse': cut
(-inf, 1.0] 0.138012
(1.0, 2.0] -1.372227
(2.0, inf] -1.612501
dtype: float64,
'DebtRatio': cut
(-inf, 0.0177] 0.446409
(0.0177, 0.228] 0.034428
(0.228, 0.346] 0.232250
(0.346, 0.494] -0.010889
(0.494, 4.0] -0.474974
(4.0, 687.0] 0.074260
(687.0, inf] 0.284212
dtype: float64,
'MonthlyIncome': cut
(-inf, 0.17] 0.987328
(0.17, 4.01] 0.242119
(4.01, 3500.0] -0.415304
(3500.0, 6666.0] -0.149977
(6666.0, inf] 0.315109
dtype: float64,
'NumberOfOpenCreditLinesAndLoans': cut
(-inf, 2.0] -0.683190
(2.0, 4.0] -0.075038
(4.0, 6.0] 0.065752
(6.0, 16.0] 0.108626
(16.0, inf] 0.323059
dtype: float64,
'NumberOfTimes90DaysLate': cut
(-inf, 1.0] 0.095259
(1.0, 2.0] -2.306599
(2.0, inf] -2.497711
dtype: float64,
'NumberRealEstateLoansOrLines': cut
(-inf, 1.0] -0.117709
(1.0, 2.0] 0.496311
(2.0, 3.0] 0.314201
(3.0, inf] -0.194260
dtype: float64,
'NumberOfTime60-89DaysPastDueNotWorse': cut
(-inf, 1.0] 0.029976
(1.0, inf] -1.845742
dtype: float64,
'NumberOfDependents': cut
(-inf, 2.753e-05] 0.707387
(2.753e-05, 1.0] -0.544937
(1.0, 1.00002] NaN
(1.00002, 2.0] -0.561289
(2.0, 2.00016] NaN
(2.00016, inf] -0.453875
dtype: float64,
'AllNumlate': cut
(-inf, 1.0] 0.463262
(1.0, 2.0] -1.605527
(2.0, 3.0] -1.994334
(3.0, 4.0] -2.258396
(4.0, inf] -2.468099
dtype: float64,
'Monthlypayment': cut
(-inf, 68.088] 0.728015
(68.088, 452.957] 0.090430
(452.957, 1398.495] -0.125359
(1398.495, 4030.857] 0.046305
(4030.857, 6037.739] -0.241663
(6037.739, inf] -0.910557
dtype: float64}
通过这段数据可以发现使用toad分箱,其中RevolvingUtilizationOfUnsecuredLines、DebtRatio、MonthlyIncome、NumberRealEstateLoansOrLines、NumberOfDependents、Monthlypayment不是完全单调,其中DebtRatio、MonthlyIncome、NumberOfDependents这几个特征最严重。
from toad.plot import badrate_plot, proportion_plot
from toad.plot import  bin_plot,badrate_plot
RevolvingUtilizationOfUnsecuredLines分析
# 可视化RevolvingUtilizationOfUnsecuredLines箱子的坏样本率
adj_var = 'RevolvingUtilizationOfUnsecuredLines'
bin_plot(train_adj, target='SeriousDlqin2yrs', x=adj_var)
可以发现在倒数第二个箱子出现了拐点,所以打算将他们合并。
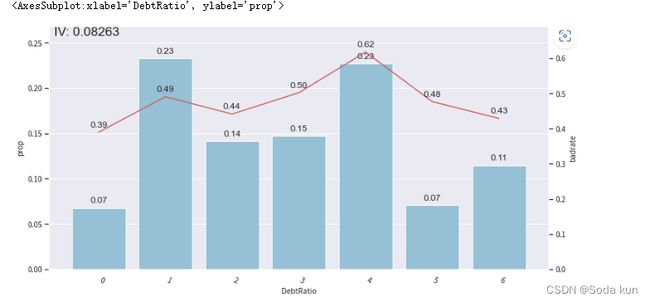
DebtRatio分析
# 可视化DebtRatio箱子的坏样本率
adj_var = 'DebtRatio'
bin_plot(train_adj, target='SeriousDlqin2yrs', x=adj_var)
之前找到的阈值是2,现在的toad分的阈值变成了4,之后进行调整,观察是否有好转。
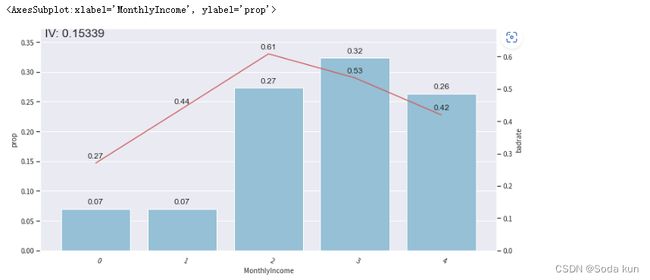
MonthlyIncome分析
# 可视化MonthlyIncome箱子的坏样本率
adj_var = 'MonthlyIncome'
bin_plot(train_adj, target='SeriousDlqin2yrs', x=adj_var)
发现月薪这个特征中有一个拐点,尝试增加一个点看能否有改善。
NumberRealEstateLoansOrLines分析
发现坏账率在之后有了一个提升,需要细致化调整分箱。
NumberOfDependents分析
这个分箱结果很奇怪,其中还有分到(1.0, 1.00002]这样的情况产生,众所周知不会0.00002个人产生,数据里都是整数,所以要对这种分箱进行剔除。同时结合之前设置的阈值5,进行尝试。
Monthlypayment分析
总体来看比较符合业务逻辑,尝试一下对分箱进行细致调节。
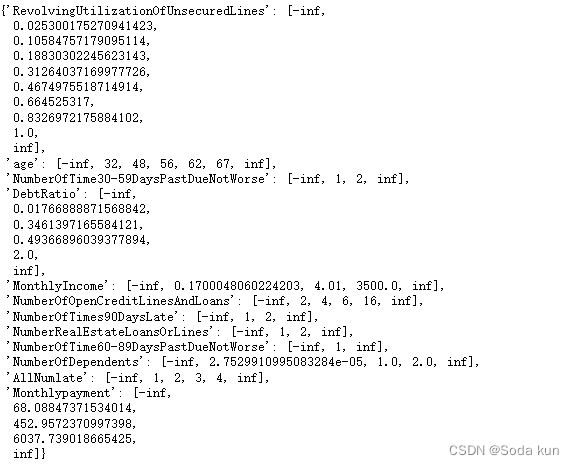
combiner.set_rules({'RevolvingUtilizationOfUnsecuredLines': [0.025300175270941423,
  0.10584757179095114,
  0.18830302245623143,
  0.31264037169977726,
  0.4674975518714914,
  0.664525317,
  0.8326972175884102,
  1],'DebtRatio': [0.011617953, 0.213376954, 0.6, 1.992015968],
  'MonthlyIncome':[3500.0, 7499.0],
  'NumberOfTime60-89DaysPastDueNotWorse':[1,2],
  'NumberOfDependents': [2.2226856401519335e-05,1.0,2.0]})
data_adj = combiner.transform(pd.concat([Y_train,X_train], axis=1))
## 这里修改箱子的情况
combiner.set_rules({'RevolvingUtilizationOfUnsecuredLines': [0.025300175270941423,
0.10584757179095114,
0.18830302245623143,
0.31264037169977726,
0.4674975518714914,
0.664525317,
0.8326972175884102,
1],'DebtRatio':[0.01766888871568842,0.3461397165584121,0.49366896039377894,4.0],
'MonthlyIncome':[0.1700048060224203, 4.01,3500.0, 7499.0],
'NumberRealEstateLoansOrLines':[1, 2],
'NumberOfDependents': [2.7529910995083284e-05,1.0,2.0]})
data_adj = combiner.transform(pd.concat([Y_train,X_train], axis=1))
# 可视化每个箱子的坏样本率
adj_var = 'NumberRealEstateLoansOrLines'
bin_plot(data_adj, target='SeriousDlqin2yrs', x=adj_var)这里还可以展示修改完后的箱子坏账率情况,这里因为篇幅原因就不展示了。
#调整箱子
adj_bin ={'RevolvingUtilizationOfUnsecuredLines': [0.025300175270941423,
  0.10584757179095114,
  0.18830302245623143,
  0.31264037169977726,
  0.4674975518714914,
  0.664525317,
  0.8326972175884102,
  1],'DebtRatio':[0.01766888871568842,0.3461397165584121,0.49366896039377894,2.0],
  'MonthlyIncome':[0.1700048060224203, 4.01,3500.0],
  'NumberRealEstateLoansOrLines':[1, 2],
  'NumberOfDependents': [2.7529910995083284e-05,1.0,2.0],
  'Monthlypayment':[68.08847371534014,452.9combiner. Transform739018665425]}
# 更新调整后的分箱
combiner.set_rules(adj_bin)
bins = combiner. Export()
bins修改分箱之后再次计算woe(检查单调性)
hand_bins_ = {k:[-np.inf,*v[:-1],v[-1],np.inf] for k,v in bins. Items()}
hand_bins_
#将所有特征的WOE存储到字典当中
woeall_ = {}
for col in hand_bins:
woeall_[col] = get_woe(model_data,col,"SeriousDlqin2yrs",hand_bins_[col])
woeall_{'RevolvingUtilizationOfUnsecuredLines': cut
(-inf, 0.0253] 2.670398
(0.0253, 0.106] 1.818123
(0.106, 0.188] 0.972773
(0.188, 0.313] 0.397586
(0.313, 0.467] -0.137443
(0.467, 0.665] -0.707083
(0.665, 0.833] -1.149674
(0.833, 1.0] -1.005857
(1.0, inf] -2.046948
dtype: float64,
'age': cut
(-inf, 32.0] -0.310471
(32.0, 48.0] -0.458418
(48.0, 56.0] -0.162071
(56.0, 62.0] 0.448978
(62.0, 67.0] 1.075670
(67.0, inf] 1.710243
dtype: float64,
'NumberOfTime30-59DaysPastDueNotWorse': cut
(-inf, 1.0] 0.138012
(1.0, 2.0] -1.372227
(2.0, inf] -1.612501
dtype: float64,
'DebtRatio': cut
(-inf, 0.0177] 0.446409
(0.0177, 0.346] 0.108933
(0.346, 0.494] -0.010889
(0.494, 2.0] -0.485991
(2.0, inf] 0.186529
dtype: float64,
'MonthlyIncome': cut
(-inf, 0.17] 0.987328
(0.17, 4.01] 0.242119
(4.01, 3500.0] -0.415304
(3500.0, inf] 0.058903
dtype: float64,
'NumberOfOpenCreditLinesAndLoans': cut
(-inf, 2.0] -0.683190
(2.0, 4.0] -0.075038
(4.0, 6.0] 0.065752
(6.0, 16.0] 0.108626
(16.0, inf] 0.323059
dtype: float64,
'NumberOfTimes90DaysLate': cut
(-inf, 1.0] 0.095259
(1.0, 2.0] -2.306599
(2.0, inf] -2.497711
dtype: float64,
'NumberRealEstateLoansOrLines': cut
(-inf, 1.0] -0.117709
(1.0, 2.0] 0.496311
(2.0, inf] 0.104692
dtype: float64,
'NumberOfTime60-89DaysPastDueNotWorse': cut
(-inf, 1.0] 0.029976
(1.0, inf] -1.845742
dtype: float64,
'NumberOfDependents': cut
(-inf, 2.75e-05] 0.707387
(2.75e-05, 1.0] -0.544937
(1.0, 2.0] -0.561335
(2.0, inf] -0.453949
dtype: float64,
'AllNumlate': cut
(-inf, 1.0] 0.463262
(1.0, 2.0] -1.605527
(2.0, 3.0] -1.994334
(3.0, 4.0] -2.258396
(4.0, inf] -2.468099
dtype: float64,
'Monthlypayment': cut
(-inf, 68.088] 0.728015
(68.088, 452.957] 0.090430
(452.957, 6037.739] -0.049358
(6037.739, inf] -0.910557
dtype: float64}
通过结果可以发现基本都是符合单调性的。
#计算WOE,仅在训练集计算WOE,不然会标签泄露
transer = toad.transform.WOETransformer()
binned_data = combiner.transform(pd.concat([Y_train,X_train], axis=1))
#对WOE的值进行转化,映射到原数据集上。对训练集用fit_transform,测试集用transform.
data_tr_woe = transer.fit_transform(binned_data, binned_data['SeriousDlqin2yrs'], exclude=['SeriousDlqin2yrs'])
data_tr_woe.head()# 先分箱
binned_data = combiner.transform(X_vali)
#对WOE的值进行转化,映射到原数据集上。测试集用transform.
data_test_woe = transer.transform(binned_data)
data_test_woe.head()5.训练模型
# 训练LR模型
from sklearn.linear_model import LogisticRegression

lr = LogisticRegression(solver='liblinear')
lr.fit(data_tr_woe.drop(['SeriousDlqin2yrs'],axis=1), data_tr_woe['SeriousDlqin2yrs'])
from sklearn import metrics
from sklearn.metrics import precision_score,recall_score,f1_score,accuracy_score,roc_curve,auc,roc_auc_score,mean_squared_error
def model_metrics(model, X, y):
y_pred = model.predict(X)
accuracy = accuracy_score(y, y_pred)
precision = precision_score(y, y_pred)
recall = recall_score(y, y_pred)
f1 = f1_score(y, y_pred)
roc_auc = roc_auc_score(y, y_pred)
fpr, tpr, thresholds = roc_curve(y, model.predict_proba(X)[:,1])
ks = max(tpr - fpr)
plt.plot(fpr, tpr, label='ROC Curve (area = %0.2f)' % roc_auc)
plt.plot(fpr, tpr)
plt.plot([0, 1], [0, 1], 'k--')
plt.xlim([0.0, 1.0])
plt.ylim([0.0, 1.05])
plt.xlabel('False Positive Rate')
plt.ylabel('True Positive Rate')
plt.title('ROC Curve')
plt.legend(loc="lower right")
plt.show()
return {'Accuracy': accuracy, 'Precision': precision, 'Recall': recall, 'F1': f1, 'ROC AUC': roc_auc,'KS': ks}print('train ',model_metrics(lr,data_tr_woe.drop(['SeriousDlqin2yrs'],axis=1), data_tr_woe['SeriousDlqin2yrs']))
print('test ',model_metrics(lr,data_test_woe,Y_vali))对分训练集和测试集上的数据进行验证,AUC面积约为0.824,说明模型对正负样本的区分能力还可以。KS值为0.65,说明模型预测性较好。
做5折交叉验证,验证模型的稳定性
from sklearn.model_selection import cross_val_score
score = cross_val_score(lr,data_tr_woe.iloc[:,1:],data_tr_woe.iloc[:,0],cv=10).mean()
print(score)
0.8243200267178935
4.2 使用手动分箱
def graphforbestbin(DF, X, Y, n=5,q=20,graph=True):
    global bins_df
    DF = DF[[X,Y]].copy()

    # 等频分箱
    DF["qcut"],bins = pd.qcut(DF[X], retbins=True, q=q,duplicates="drop")
    coount_y0 = DF.loc[DF[Y]==0].groupby(by="qcut").count()[Y]
    coount_y1 = DF.loc[DF[Y]==1].groupby(by="qcut").count()[Y]
    num_bins = [*zip(bins,bins[1:],coount_y0,coount_y1)]

    # 判断分箱后每个箱内是否都有好坏样本,没有的进行合并
    for i in range(q):
        if 0 in num_bins[0][2:]:
            num_bins[0:2] = [(
                num_bins[0][0],
                num_bins[1][1],
                num_bins[0][2]+num_bins[1][2],
                num_bins[0][3]+num_bins[1][3])]
            continue

        for i in range(len(num_bins)):
            if 0 in num_bins[i][2:]:
                num_bins[i-1:i+1] = [(
                    num_bins[i-1][0],
                    num_bins[i][1],
                    num_bins[i-1][2]+num_bins[i][2],
                    num_bins[i-1][3]+num_bins[i][3])]
                break
        else:
            break

    # 计算WOE值
    def get_woe(num_bins):
        columns = ["min","max","count_0","count_1"]
        df = pd.DataFrame(num_bins,columns=columns)
        df["total"] = df.count_0 + df.count_1
        df["percentage"] = df.total / df.total.sum()
        df["bad_rate"] = df.count_1 / df.total
        df["good%"] = df.count_0/df.count_0.sum()
        df["bad%"] = df.count_1/df.count_1.sum()
        df["woe"] = np.log(df["good%"] / df["bad%"])
        return df

    # 计算IV值
    def get_iv(df):
        rate = df["good%"] - df["bad%"]
        iv = np.sum(rate * df.woe)
        return iv

    # 利用卡方检验进行分箱,将两类相近的样本进行合并
    # 合并方式为按照大小顺序改变上下限
    IV = []
    axisx = []
    while len(num_bins) > n:
        pvs = []
        for i in range(len(num_bins)-1):
            x1 = num_bins[i][2:]
            x2 = num_bins[i+1][2:]
            pv = scipy.stats.chi2_contingency([x1,x2])[1]
            pvs.append(pv)

        i = pvs.index(max(pvs))
        num_bins[i:i+2] = [(
            num_bins[i][0],
            num_bins[i+1][1],
            num_bins[i][2]+num_bins[i+1][2],
            num_bins[i][3]+num_bins[i+1][3])]

        bins_df = pd.DataFrame(get_woe(num_bins))

        axisx.append(len(num_bins))
        IV.append(get_iv(bins_df))
    # 具体分多少箱,不看卡方值和p值,根据IV值来进行判断
    # 绘制出不同分箱效果下的IV值,选取最佳的分箱策略
    if graph:
        plt.figure()
        plt.plot(axisx,IV)
        plt.xticks(axisx)
        plt.xlabel("number of box")
        plt.ylabel("IV")
        plt.show()
    return bins_df
model_data.columns ##选出所有的名字for i in model_data.columns[1:]:
print(i)
graphforbestbin(model_data,i,"SeriousDlqin2yrs",n=2,q=20)结合画出图线上的拐点进行分析
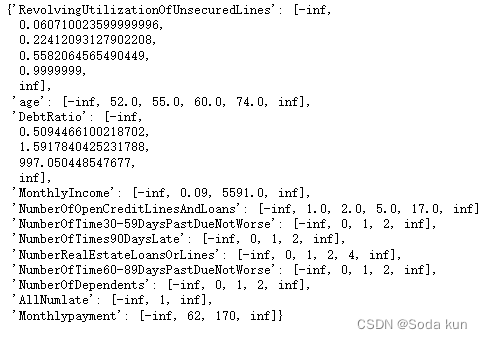
我们发现,不是所有的特征都可以使用这个分箱函数,比如说有的特征,像家人数量,就无法分出20组。于是我们将可以分箱的特征放出来单独分组,不能自动分箱的变量自己观察然后手写
auto_col_bins = {"RevolvingUtilizationOfUnsecuredLines":5,
                 "age":5,
                 "DebtRatio":4,
                 "MonthlyIncome":3,
                 "NumberOfOpenCreditLinesAndLoans":5}
#不能使用自动分箱的变量
hand_bins = {"NumberOfTime30-59DaysPastDueNotWorse":[0,1,2,13]
             ,"NumberOfTimes90DaysLate":[0,1,2,17]
             ,"NumberRealEstateLoansOrLines":[0,1,2,4,54]
             ,"NumberOfTime60-89DaysPastDueNotWorse":[0,1,2,8]
             ,"NumberOfDependents":[0,1,2,3]
             ,"AllNumlate":[1,2]
             ,"Monthlypayment":[62,170,5005]}
#保证区间覆盖使用 np.inf替换最大值,用-np.inf替换最小值
hand_bins = {k:[-np.inf,*v[:-1],np.inf] for k,v in hand_bins.items()}
bins_of_col = {}
# 生成自动分箱的分箱区间和分箱后的 IV 值
for col in auto_col_bins:
bins_df = graphforbestbin(model_data,col
,"SeriousDlqin2yrs"
,n=auto_col_bins[col]
#使用字典的性质来取出每个特征所对应的箱的数量
,q=20
,graph=False)
bins_list = sorted(set(bins_df["min"]).union(bins_df["max"]))
#保证区间覆盖使用 np.inf 替换最大值 -np.inf 替换最小值
bins_list[0],bins_list[-1] = -np.inf,np.inf
bins_of_col[col] = bins_list## 合并手动分箱数据
bins_of_col.update(hand_bins)
bins_of_col计算各箱的WOE并映射到数据中 —表示箱子中不违约的个数
## 定义一个函数
def get_woe(df,col,y,bins):
    df = df[[col,y]].copy()
    df["cut"] = pd.cut(df[col],bins)
    bins_df = df.groupby("cut")[y].value_counts().unstack()
    woe = bins_df["woe"] = np.log((bins_df[0]/bins_df[0].sum())/(bins_df[1]/bins_df[1].sum()))
    return woe
#将所有特征的WOE存储到字典当中
woeall = {}
for col in bins_of_col:
woeall[col] = get_woe(model_data,col,"SeriousDlqin2yrs",bins_of_col[col])
woeall{'RevolvingUtilizationOfUnsecuredLines': cut
(-inf, 0.0607] 2.445906
(0.0607, 0.224] 1.093637
(0.224, 0.558] -0.115487
(0.558, 1.0] -1.020286
(1.0, inf] -2.026729
dtype: float64,
'age': cut
(-inf, 52.0] -0.398864
(52.0, 55.0] -0.085321
(55.0, 60.0] 0.291015
(60.0, 74.0] 1.091778
(74.0, inf] 2.170012
dtype: float64,
'DebtRatio': cut
(-inf, 0.509] 0.110557
(0.509, 1.592] -0.497018
(1.592, 997.05] -0.010297
(997.05, inf] 0.325134
dtype: float64,
'MonthlyIncome': cut
(-inf, 0.09] 1.065920
(0.09, 5591.0] -0.219651
(5591.0, inf] 0.233455
dtype: float64,
'NumberOfOpenCreditLinesAndLoans': cut
(-inf, 1.0] -0.968510
(1.0, 2.0] -0.377787
(2.0, 5.0] -0.030242
(5.0, 17.0] 0.108827
(17.0, inf] 0.357950
dtype: float64,
'NumberOfTime30-59DaysPastDueNotWorse': cut
(-inf, 0.0] 0.365083
(0.0, 1.0] -0.890458
(1.0, 2.0] -1.368869
(2.0, inf] -1.606605
dtype: float64,
'NumberOfTimes90DaysLate': cut
(-inf, 0.0] 0.254072
(0.0, 1.0] -1.808553
(1.0, 2.0] -2.312452
(2.0, inf] -2.487240
dtype: float64,
'NumberRealEstateLoansOrLines': cut
(-inf, 0.0] -0.349920
(0.0, 1.0] 0.192087
(1.0, 2.0] 0.507934
(2.0, 4.0] 0.264552
(4.0, inf] -0.573695
dtype: float64,
'NumberOfTime60-89DaysPastDueNotWorse': cut
(-inf, 0.0] 0.129852
(0.0, 1.0] -1.400257
(1.0, 2.0] -1.837912
(2.0, inf] -1.937154
dtype: float64,
'NumberOfDependents': cut
(-inf, 0.0] 0.698735
(0.0, 1.0] -0.540765
(1.0, 2.0] -0.556630
(2.0, inf] -0.454173
dtype: float64,
'AllNumlate': cut
(-inf, 1.0] 0.461475
(1.0, inf] -1.923934
dtype: float64,
'Monthlypayment': cut
(-inf, 62.0] 0.664595
(62.0, 170.0] 0.214426
(170.0, inf] -0.098940
dtype: float64}
可以看出数据基本符合单调。
建模与模型验证
## 处理测试集
vali_woe = pd.DataFrame(index = vali_data.index)
for col in bins_of_col:
vali_woe[col] = pd.cut(vali_data[col],bins_of_col[col]).map(woeall[col])
vali_woe["SeriousDlqin2yrs"] = vali_data["SeriousDlqin2yrs"]
vali_woevali_X = vali_woe.iloc[:,:-1]
vali_y = vali_woe.iloc[:,-1]## 开始顺利建模
X = model_woe.iloc[:,:-1]
y = model_woe.iloc[:,-1]
from sklearn.linear_model import LogisticRegression as LR
lr = LR().fit(X,y)
lr.score(vali_X,vali_y)返回预测值为 0.7892696467885517
调整模型参数
这里主要调整sklearn中逻辑回归的最大迭代次数max_iter,通过画学习曲线找到最佳的状态。
c_1 = np.linspace(0.01,1,20)
score = []
for i in c_1:
    lr = LR(solver='liblinear',C=i).fit(X,y)
    score.append(lr.score(vali_X,vali_y))
plt.figure()
plt.plot(c_1,score)
plt.show()
score = []
for i in np.arange(1,500,100):
lr = LR(solver='liblinear',C=0.025,max_iter=i).fit(X,y)
score.append(lr.score(vali_X,vali_y))
plt.figure()
plt.plot([1,2,3,4,5,6],score)
plt.show()
最优的迭代次数定为4。
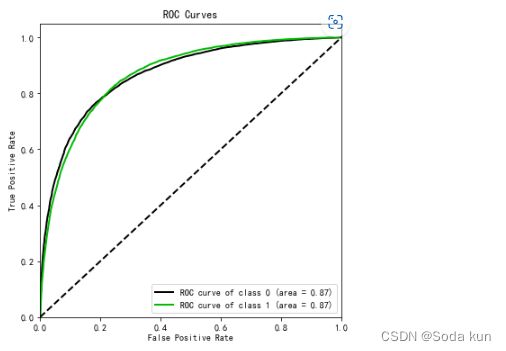
import scikitplot as skplt
vali_proba_df = pd.DataFrame(lr.predict_proba(vali_X))
skplt.metrics.plot_roc(vali_y, vali_proba_df,
                       plot_micro=False,figsize=(6,6),
                       plot_macro=False)
### 0.581表示在验证集上计算得到的KS值
import scikitplot as skplt
fig, ax = plt.subplots(figsize=(7,6))
vali_proba_df = pd.DataFrame(lr.predict_proba(vali_X))
skplt.metrics.plot_ks_statistic(vali_y, vali_proba_df,ax=ax)5.建立评分卡
其中A与B是常数,A叫做“补偿”,B叫做“刻度”,log(odds)代表了一个人违约的可能性。
例如,本案例中假设对数几率为![]() 时设定的特定分数为600,如果PDO=20,那么对数几率为
时设定的特定分数为600,如果PDO=20,那么对数几率为![]() 时的分数就是620。带入以上线性表达式,可以得到:
时的分数就是620。带入以上线性表达式,可以得到:
将两个式子联立,用numpy可以很容易求出A和B的值:
B = 20/np.log(2)
A = 600+B*np.log(1/60)
base_score = A - B*lr.intercept_   ##lr.intercept代表截距
base_score
file = "D:/ScoreData.csv"
#open是用来打开文件的python命令,第一个参数是文件的路径+文件名,如果你的文件是放在根目录下,则你只需要
#文件名就好
#第二个参数是打开文件后的用途,"w"表示用于写入,通常使用的是"r",表示打开来阅读
#首先写入基准分数
#之后使用循环,每次生成一组score_age类似的分档和分数,不断写入文件之中
with open(file,"w") as fdata:
fdata.write("base_score,{}\n".format(base_score))
for i,col in enumerate(X.columns):
score = woeall[col] * (-B*lr.coef_[0][i])
score.name = "Score"
score.index.name = col
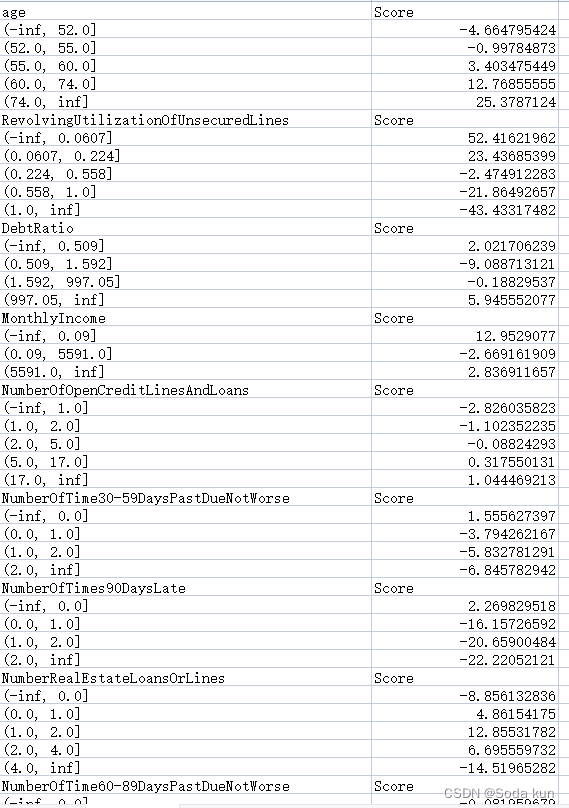
score.to_csv(file, header=True,mode="a")得到评分卡的数值:
总结
通过评分卡这个项目,熟悉了WOE和IV值,虽然对别的模型可能用处不大,但在银行风控领域很常用,另外,由于数据中有很多的异常值不知道该怎么处理时,也见识到了数据分箱这种方法的强大。
以上就是银行信用评分卡建模分析项目的全部内容,感谢大家的阅读!
参考资料
5 3.1 案例:用逻辑回归制作评分卡 - 评分卡与完整的模型开发流程_哔哩哔哩_bilibili
数据挖掘项目:银行信用评分卡建模分析(上篇)_AvenueCyy的博客-CSDN博客
