第55步 深度学习图像识别:CNN特征层和卷积核可视化(TensorFlow)
基于WIN10的64位系统演示
一、写在前面
(1)CNN可视化
在理解和解释卷积神经网络(CNN)的行为方面,可视化工具起着重要的作用。以下是一些可以用于可视化的内容:
(a)激活映射(Activation maps):可以显示模型在训练过程中的激活情况,这可以帮助我们理解每一层(或每个过滤器)在识别图像的哪个部分。
(b)过滤器(Filter):可以将卷积核或过滤器的权重可视化,以了解模型在寻找什么样的特征。
(c)类激活映射(Class Activation Mapping,CAM):这是一种可视化技术,可以用于理解网络为什么会将图像分类到特定类别中。这通过生成一个热图来实现,该热图高亮显示网络认为对分类决策最重要的区域。
(d)混淆矩阵(Confusion Matrix):在分类问题中,混淆矩阵可以帮助我们理解模型在各个类别上的性能,显示模型何时正确分类,何时出现错误。
(e)学习曲线(Learning Curves):显示训练和验证误差随着训练周期(或时间)的变化,可以帮助我们理解模型是否过拟合,是否需要更多的训练等。
(2)激活映射和过滤器
由于混淆矩阵和学习曲线之前都已经给了代码,这一期主要介绍激活映射和过滤器(卷积层)。用的模型是Mobilenet_v2,以为够快!!
二、CNN可视化实战
继续使用胸片的数据集:肺结核病人和健康人的胸片的识别。其中,肺结核病人700张,健康人900张,分别存入单独的文件夹中。
(a)Mobilenet_v2建模
######################################导入包###################################
from tensorflow import keras
import tensorflow as tf
from tensorflow.python.keras.layers import Dense, Flatten, Conv2D, MaxPool2D, Dropout, Activation, Reshape, Softmax, GlobalAveragePooling2D, BatchNormalization
from tensorflow.python.keras.layers.convolutional import Convolution2D, MaxPooling2D
from tensorflow.python.keras import Sequential
from tensorflow.python.keras import Model
from tensorflow.python.keras.optimizers import adam_v2
import numpy as np
import matplotlib.pyplot as plt
from tensorflow.python.keras.preprocessing.image import ImageDataGenerator, image_dataset_from_directory
from tensorflow.python.keras.layers.preprocessing.image_preprocessing import RandomFlip, RandomRotation, RandomContrast, RandomZoom, RandomTranslation
import os,PIL,pathlib
import warnings
#设置GPU
gpus = tf.config.list_physical_devices("GPU")

if gpus:
    gpu0 = gpus[0] #如果有多个GPU,仅使用第0个GPU
    tf.config.experimental.set_memory_growth(gpu0, True) #设置GPU显存用量按需使用
    tf.config.set_visible_devices([gpu0],"GPU")

warnings.filterwarnings("ignore")             #忽略警告信息
plt.rcParams['font.sans-serif'] = ['SimHei']  # 用来正常显示中文标签
plt.rcParams['axes.unicode_minus'] = False    # 用来正常显示负号

################################导入数据集#####################################
#1.导入数据
data_dir = "./MTB"
data_dir = pathlib.Path(data_dir)
image_count = len(list(data_dir.glob('*/*')))
print("图片总数为:",image_count)

batch_size = 32
img_height = 100
img_width  = 100

train_ds = image_dataset_from_directory(
    data_dir,
    validation_split=0.2,
    subset="training",
    seed=12,
    image_size=(img_height, img_width),
    batch_size=batch_size)

val_ds = image_dataset_from_directory(
    data_dir,
    validation_split=0.2,
    subset="validation",
    seed=12,
    image_size=(img_height, img_width),
    batch_size=batch_size)

class_names = train_ds.class_names
print(class_names)
print(train_ds)


#2.检查数据
for image_batch, labels_batch in train_ds:
    print(image_batch.shape)
    print(labels_batch.shape)
    break

#3.配置数据
AUTOTUNE = tf.data.AUTOTUNE

def train_preprocessing(image,label):
    return (image/255.0,label)

train_ds = (
    train_ds.cache()
    .shuffle(800)
    .map(train_preprocessing)
    .prefetch(buffer_size=AUTOTUNE)
)

val_ds = (
    val_ds.cache()
    .map(train_preprocessing)
    .prefetch(buffer_size=AUTOTUNE)
)

#4. 数据可视化
plt.figure(figsize=(10, 8))  # 图形的宽为10高为5
plt.suptitle("数据展示")

class_names = ["Tuberculosis","Normal"]

for images, labels in train_ds.take(1):
    for i in range(15):
        plt.subplot(4, 5, i + 1)
        plt.xticks([])
        plt.yticks([])
        plt.grid(False)

        # 显示图片
        plt.imshow(images[i])
        # 显示标签
        plt.xlabel(class_names[labels[i]-1])

plt.show()

######################################数据增强函数################################

data_augmentation = Sequential([
  RandomFlip("horizontal_and_vertical"),
  RandomRotation(0.2),
  RandomContrast(1.0),
  RandomZoom(0.5,0.2),
  RandomTranslation(0.3,0.5),
])

def prepare(ds):
    ds = ds.map(lambda x, y: (data_augmentation(x, training=True), y), num_parallel_calls=AUTOTUNE)
    return ds
train_ds = prepare(train_ds)

################################导入mobilenet_v2################################
#获取预训练模型对输入的预处理方法
from tensorflow.python.keras.applications import mobilenet_v2
from tensorflow.python.keras import Input, regularizers
IMG_SIZE = (img_height, img_width, 3)

# 创建输入张量
inputs = Input(shape=IMG_SIZE)
# 定义基础模型,并将 inputs 传入
base_model = mobilenet_v2.MobileNetV2(input_tensor=inputs,
                                      include_top=False,
                                      weights='imagenet')

#从基础模型中获取输出
x = base_model.output
#全局池化
x = GlobalAveragePooling2D()(x)
#BatchNormalization
x = BatchNormalization()(x)
#Dropout
x = Dropout(0.8)(x)
#Dense
x = Dense(128, kernel_regularizer=regularizers.l2(0.1))(x)  # 全连接层减少到128,添加 L2 正则化
#BatchNormalization
x = BatchNormalization()(x)
#激活函数
x = Activation('relu')(x)
#输出层
outputs = Dense(2, kernel_regularizer=regularizers.l2(0.1))(x)  # 添加 L2 正则化
#BatchNormalization
outputs = BatchNormalization()(outputs)
#激活函数
outputs = Activation('sigmoid')(outputs)
#整体封装
model = Model(inputs, outputs)
#打印模型结构
print(model.summary())

#############################编译模型#########################################
#定义优化器
from tensorflow.python.keras.optimizers import adam_v2, rmsprop_v2
optimizer = adam_v2.Adam()


#编译模型
model.compile(optimizer=optimizer,
                loss='sparse_categorical_crossentropy',
                metrics=['accuracy'])

#训练模型
from tensorflow.python.keras.callbacks import ModelCheckpoint, Callback, EarlyStopping, ReduceLROnPlateau, LearningRateScheduler

NO_EPOCHS = 50
PATIENCE  = 10
VERBOSE   = 1

# 设置动态学习率
annealer = LearningRateScheduler(lambda x: 1e-5 * 0.99 ** (x+NO_EPOCHS))

# 设置早停
earlystopper = EarlyStopping(monitor='loss', patience=PATIENCE, verbose=VERBOSE)

#
checkpointer = ModelCheckpoint('mtb_jet_best_model_mobilenetv3samll.h5',
                                monitor='val_accuracy',
                                verbose=VERBOSE,
                                save_best_only=True,
                                save_weights_only=True)

train_model  = model.fit(train_ds,
                  epochs=NO_EPOCHS,
                  verbose=1,
                  validation_data=val_ds,
                  callbacks=[earlystopper, checkpointer, annealer])
(b)将前M层每个中间激活的所有通道可视化
from tensorflow.python.keras.preprocessing.image import ImageDataGenerator
from tensorflow.python.keras import Model
import matplotlib.pyplot as plt
from tensorflow.python.keras.models import load_model
from tensorflow.python.keras.preprocessing import image
from tensorflow.python.keras.preprocessing.image import img_to_array
from PIL import Image

if __name__=='__main__':
    #加载保存的模型
    model=load_model('mtb_jet_best_model_mobilenet.h5')
    model.summary()

    #加载一张猫的图像
    img=image.load_img(path='./MTB/Tuberculosis/Tuberculosis-203.png',target_size=(img_width,img_height))
    img_tensor=img_to_array(img)
    img_tensor=img_tensor.reshape((1,)+img_tensor.shape)
    img_tensor/=255.
    plt.imshow(img_tensor[0])
    plt.show()

    N=25#提取前N层的输出
    layer_outputs=[layer.output for layer in model.layers[:N]]
    activation_model=Model(inputs=model.input,outputs=layer_outputs)

    #以预测模式运行模型 activations包含卷积层的N个输出
    activations=activation_model.predict(img_tensor)
    print(activations[0].shape)

    first_layer_activation = activations[0]
    plt.matshow(first_layer_activation[0, :, :, 1], cmap='viridis')
    plt.show()
    #清空当前图像
    #plt.clf()

    #将每个中间激活的所有通道可视化
    layer_names = []
    for layer in model.layers[:N]:
        layer_names.append(layer.name)
        images_per_row = 16
        for layer_name, layer_activation in zip(layer_names, activations):
            n_features = layer_activation.shape[-1]
            size = layer_activation.shape[1]
            n_cols = n_features // images_per_row
            display_grid = np.zeros((size * n_cols, images_per_row * size))
            for col in range(n_cols):
                for row in range(images_per_row):
                    channel_image = layer_activation[0,:, :,col * images_per_row + row]
                    channel_image -= channel_image.mean()
                    channel_image /= channel_image.std()
                    channel_image *= 64
                    channel_image += 128
                    channel_image = np.clip(channel_image, 0, 255).astype('uint8')
                    display_grid[col * size : (col + 1) * size,
                    row * size : (row + 1) * size] = channel_image

        scale = 1. / size
        plt.figure(figsize=(scale * display_grid.shape[1],
        scale * display_grid.shape[0]))
        plt.title(layer_name)
        plt.grid(False)
        plt.imshow(display_grid, aspect='auto', cmap='viridis')
        plt.show()
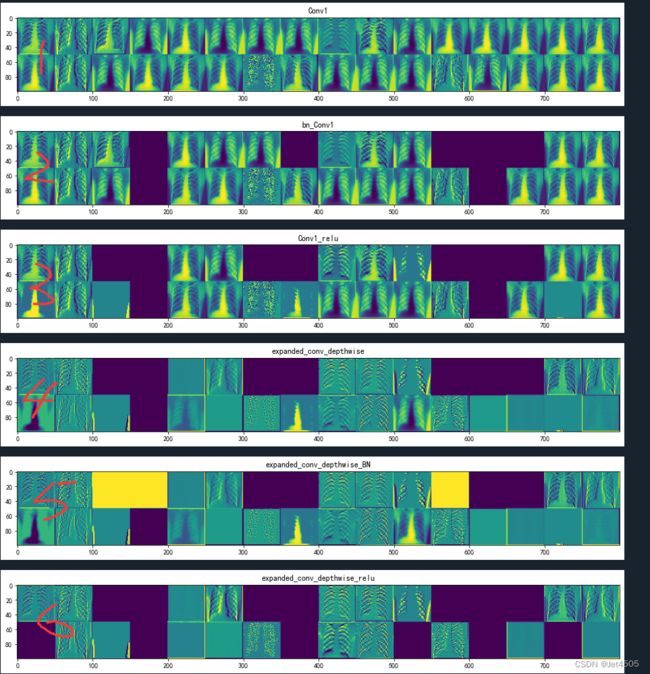
这个代码输出了模型的前25层的所有中间的激活图层。
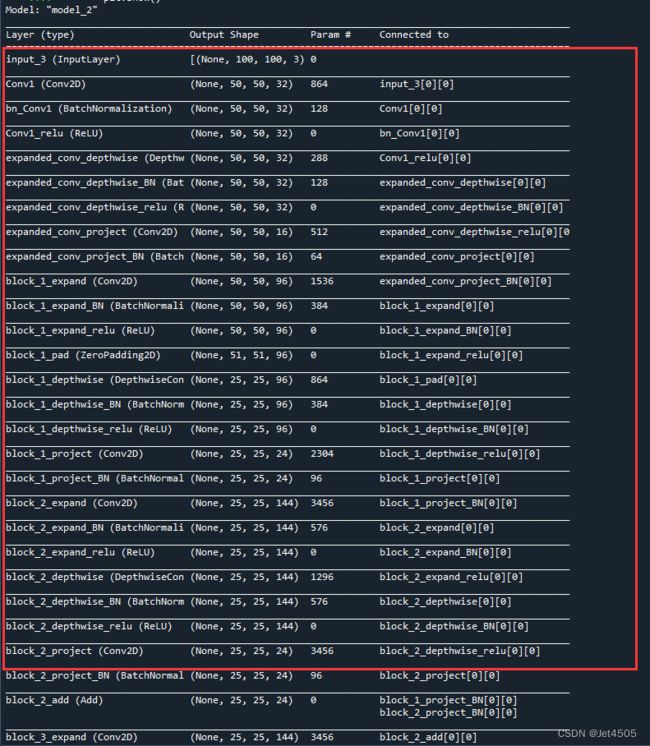
首先我们来看看模型结构,非常长的一个表格:
注意哈,第一层是输入层,所以后面是不会输出的。只会输出后24个图层:
先来看前六个图层的处理:
(1)Conv1 (Conv2D): 这是一个卷积层,它对输入图像进行卷积操作以提取图像的局部特征。在这个例子中,这个层级的输出形状为(50, 50, 32),表示该层使用了32个卷积核,生成了32个特征图(feature map),每个特征图的尺寸是50x50。
(2)bn_Conv1 (BatchNormalization): 这是一个批标准化层,它将卷积层的输出进行标准化处理,使得结果的均值接近0,标准差接近1。这个操作可以提高模型的训练速度和模型性能。
(3)Conv1_relu (ReLU): 这是一个ReLU激活函数,它对上一层的输出应用非线性变换(将所有负值变为0)。这样可以增加模型对复杂模式的学习能力。
(4)expanded_conv_depthwise (DepthwiseConv2D): 这是一个深度可分离卷积层,它首先对每个输入通道分别进行卷积操作,然后再通过1x1的卷积将这些结果进行组合。这种操作相比传统的卷积操作可以减少模型的参数和计算量。
(5-6)expanded_conv_depthwise_BN (BatchNormalization) 和 expanded_conv_depthwise_relu (ReLU): 这两个层和上面的bn_Conv1、Conv1_relu层的操作是类似的,也是分别对深度卷积层的结果进行标准化和ReLU非线性变换。
接着,往后看:
继续解读:
(7)expanded_conv_project (Conv2D): 这是一个卷积层,它对上一层的深度卷积层的输出进行处理,输出形状为(50, 50, 16)。
(8)expanded_conv_project_BN (BatchNormalization): 这是一个批标准化层,对卷积层的输出进行标准化处理。
(9-10)block_1_expand (Conv2D) 和 block_1_expand_BN (BatchNormalization): 这是另一个卷积层和批标准化层,它们对上一层的输出进行卷积操作和标准化操作,输出形状为(50, 50, 96)。
(11)block_1_expand_relu (ReLU): 这是一个ReLU激活函数,它对上一层的输出应用非线性变换(将所有负值变为0)。
(12)block_1_pad (ZeroPadding2D): 这是一个零填充层,它在输入的周围填充零以保持特征图的空间尺寸。
(13-14)block_1_depthwise (DepthwiseConv2D) 和 block_1_depthwise_BN (BatchNormalization): 这是深度可分离卷积层和批标准化层,它们对上一层的输出进行深度卷积操作和标准化操作,输出形状为(25, 25, 96)。
(15)block_1_depthwise_relu (ReLU): 这又是一个ReLU激活函数,它对上一层的输出应用非线性变换。
(16-17)block_1_project (Conv2D) 和 block_1_project_BN (BatchNormalization): 这是卷积层和批标准化层,它们对上一层的输出进行卷积操作和标准化操作,输出形状为(25, 25, 24)。
(18-24)接下来的block_2_expand (Conv2D) 到 block_2_project (Conv2D) 层:是另一个与block_1相似的模块,只不过输入形状改变了。它们进行的操作和上述的操作大致相同,也是包含卷积、批标准化和ReLU激活等操作。
注意看:以上每个层级都在处理和转化上一层的输出,以便提取和学习图像的特征。这样的架构可以帮助模型捕捉到更复杂的模式和特征。通俗来说,就是随着层数增加,就越能看到细节!其中黄色的部分是模型重点关注的区域!
(b)显示第M层输出的第L个通道图像
##加载保存的模型
from tensorflow.python.keras.models import load_model
from tensorflow.python.keras.preprocessing import image
from tensorflow.python.keras.preprocessing.image import img_to_array
from PIL import Image
if __name__=='__main__':
    model=load_model('mtb_jet_best_model_mobilenet.h5')
    model.summary()

    #加载一张图像
    img=image.load_img(path='./MTB/Tuberculosis/Tuberculosis-203.png',target_size=(img_width,img_height))
    img_tensor=img_to_array(img)
    img_tensor=img_tensor.reshape((1,)+img_tensor.shape)
    img_tensor/=255.
    plt.imshow(img_tensor[0])
    plt.show()

    M=25#提取前M层的输出
    layer_outputs=[layer.output for layer in model.layers[:M]]
    activation_model=Model(inputs=model.input,outputs=layer_outputs)

    #以预测模式运行模型 activations包含卷积层的M个输出
    activations=activation_model.predict(img_tensor)
    print(activations[M-1].shape)

    first_layer_activation = activations[M-1]
    L=3 # 显示第L个通道的图像
    plt.matshow(first_layer_activation[0, :, :, L-1], cmap='viridis')
    plt.show()
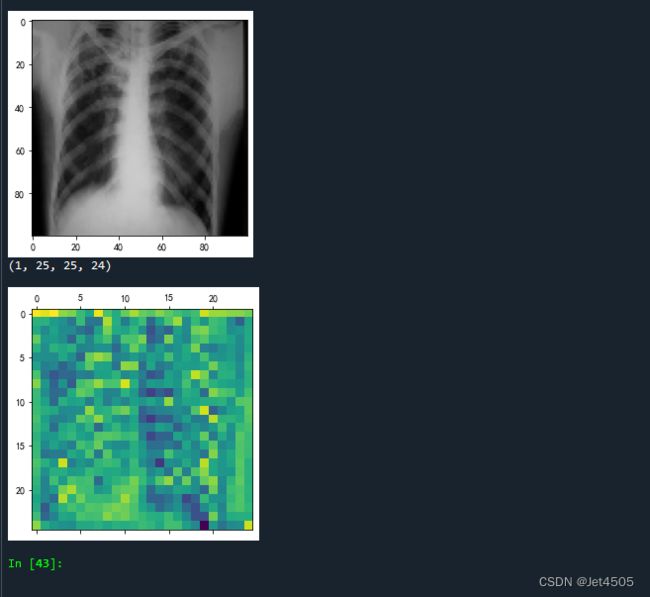
输出如下:
第24层输出的图像,黄色的部分是模型重点关注的区域!
我们再看看更深层次的图像,比如第80层:
太过于抽象,哈哈哈哈!
(c)可视化过滤器(卷积核)
# 获取基础模型的第一层,即Conv2D层的权重
for layer in base_model.layers:
    if isinstance(layer, Conv2D):
        weights = layer.get_weights()[0]
        break

# 将权重缩放到0-1
weights_min = weights.min()
weights_max = weights.max()
weights = (weights - weights_min) / (weights_max - weights_min)

# 获取过滤器数量
num_filters = weights.shape[-1]

# 循环遍历所有过滤器
for i in range(num_filters):
    # 获取第i个过滤器
    filter = weights[:, :, :, i]

    # 为过滤器创建一个子图
    plt.subplot(num_filters//4 + 1, 4, i+1)

    # 显示过滤器
    plt.imshow(filter)

    # 删除坐标轴
    plt.axis('off')

# 显示整个图
plt.show()
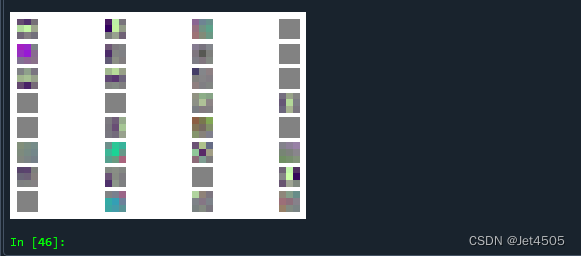
这个更加抽象哈:
三、写在最后
激活映射是每个卷积层通过卷积操作与激活函数处理后的输出结果,它展示了网络在特定层级对输入图像的响应,可视化这些激活映射有助于我们理解模型学习到的特征与决策过程。通过上面的例子,相信大家对于CNN的原理有更直观的认识吧。
四、数据
链接:https://pan.baidu.com/s/15vSVhz1rQBtqNkNp2GQyVw?pwd=x3jf
提取码:x3jf


