界面控件DevExpress BI Dashboard v23.1——支持全新的图标趋势指标
DevExpress BI Dashboard v23.1支持在Dashboard图表项中使用趋势指标,趋势指标有助于传达一段时间内的数据趋势——允许用户发现模式并更有效地分析复杂的数据集。
使用DevExpress Analytics Dashboard,再选择合适的UI元素(图表、数据透视表、数据卡、计量器、地图和网格),删除相应参数、值和序列的数据字段,就可以轻松地为执行主管和商业用户创建有洞察力、信息丰富的、跨平台和设备的决策支持系统。
DevExpress Dashboard v23.1正式版下载(Q技术交流:523159565)
DevExpress BI Dashboard支持以下趋势指标(跨所有支持的平台):
- Trend line (ChartTrendLine):显示相关点的大致方向(通常用于识别现有数据趋势和预测未来趋势)。
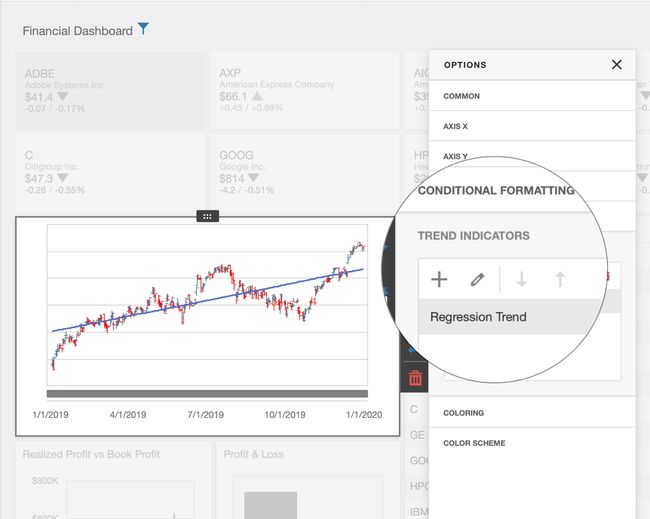
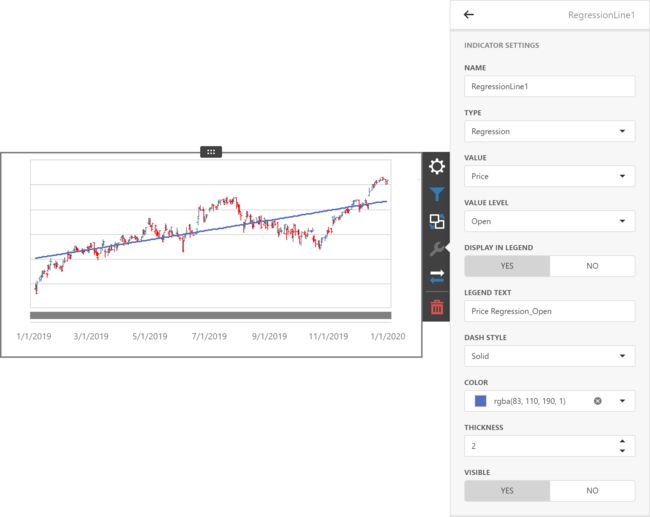
- Regression line (ChartRegressionLine):使用数学公式将数据可视化,该数学公式将线本身与相关数据点之间的距离最小化(通常用于对两个变量之间的关系进行建模,并可用于根据另一个变量的值对一个变量进行预测)。
- Custom Indicator (ChartCustomIndicator):允许您添加自己的指标类型,来可视化销售趋势和呈现财务模式。
您可以通过Dashboard的UI和代码创建、编辑和删除这些指示器。
终端用户体验
最终用户可以通过Dashboard的UI管理趋势指标集合。
- 在Web Dashboard设计器中,单击Options对话框中的Trend Indicators,打开Trend Indicators编辑器。
- 在WinForms Dashboard设计器中,单击Ribbon's Analysis分组(Data Ribbon页面)中的Trend Indicators按钮。该命令调用Trend Indicators编辑器对话框,编辑器允许用户创建/编辑/删除趋势指标。
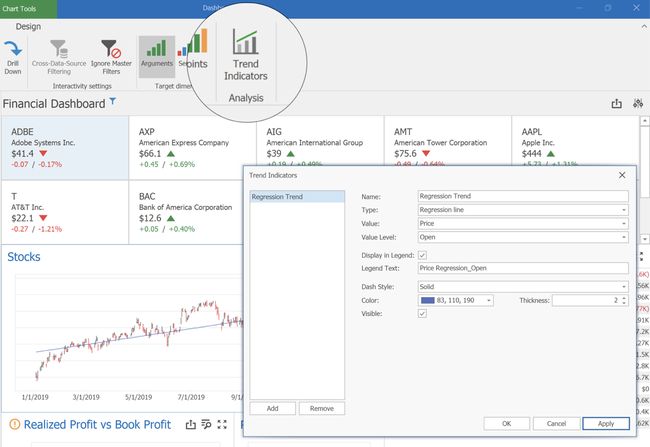
使用默认设置生成一个新的指标,用户可以更改指标类型、外观设置或特定于图表系列类型的设置(例如,用户可以选择计算财务系列指标的值:开盘价、高点、低点或收盘价)。
运行时
在运行时,您需要创建一个ChartTrendLine或ChartRegressionLine对象,并将其添加到ChartDashboardItem.Indicators中。完成后,使用下面列出的API来指定指标设置。
此属性是必需的,并在启动应用程序时在图表仪表板项中显示指示器:
- Value
如果不指定以下属性,则使用默认值:
- Name
- ValueLevel
- ShowInLegend
- LegendText
- Thickness
- Color
- DashStyle
- Visible
下面的代码片段一个ASP. NET Core Dashboard应用程序创建了一个“销售趋势”指示器。
using DevExpress.DashboardCommon;
using System.Drawing;
// ...
public partial class CustomIndicatorDashboard : DevExpress.DashboardCommon.Dashboard {
public CustomIndicatorDashboard() {
InitializeComponent();
ChartDashboardItem chartItem = Items.First(x => x.ComponentName == "chartDashboardItem1") as ChartDashboardItem;
ChartTrendLine trendLine = new ChartTrendLine();
SimpleSeries simpleSeries = chartItem.Panes[0].Series[0] as SimpleSeries;
if (simpleSeries != null) {
trendLine.Value = simpleSeries.Value.UniqueId;
}
trendLine.Name = "SalesTrend";
trendLine.ValueLevel = DevExpress.XtraCharts.ValueLevel.Value;
trendLine.Color = Color.Orange;
trendLine.LegendText = "Sales Trend";

chartItem.Indicators.Add(trendLine);
}
}
添加自定义指标类型
您可以创建自己的自定义指标类型来满足特定的业务需求:
- 创建一个ChartCustomIndicator后代,它接受数据点的集合、计算值,并返回结果点,这些点用于绘制指示器。
- 在IndicatorFactory 中注册结果类型,来使该类作为指示器类型可用。
如果使用Web Dashboard,请在呈现控件之前注册ChartIndicatorsExtension(以便将自定义指示器类型添加到Trend Indicators编辑器)。
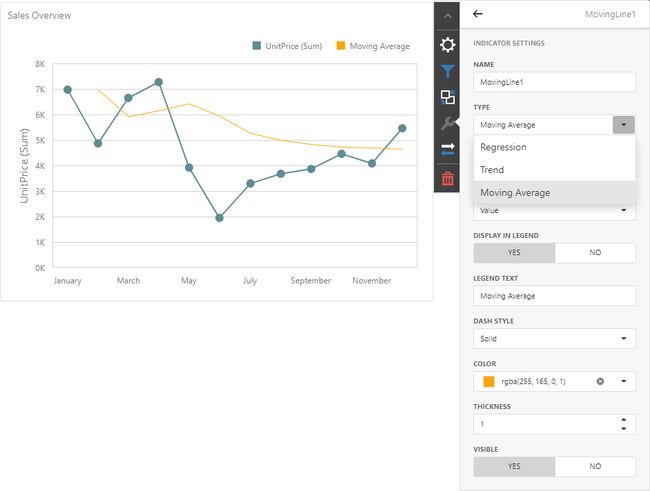
下面的代码片段在ASP. NET Core Dashboard中实现/注册一个“移动平均线”自定义指标类型。
using DevExpress.DashboardCommon;
using DevExpress.DashboardCommon.ViewerData;
using System.Collections.Generic;

namespace asp_net_core_dashboard_control_trendline_indicators.Data {
public class MovingIndicator : ChartCustomIndicator {
protected override Dictionary Calculate(Dictionary values) {
var items = new Dictionary(values.Count);

var sum = decimal.Zero;
var count = 0;
foreach(KeyValuePair point in values) {
if(count == 0) {
items.Add(point.Key, null);
} else {
items.Add(point.Key, sum / count);
}
sum += point.Value ?? 0;
count++;
}

return items;
}
}
}
在保存和加载指示板之前,在应用程序中调用Register方法(在指示板的XML中序列化和反序列化指示符)。
using DevExpress.DashboardWeb;
using TrendIndicators.Data;

namespace TrendIndicators {
public static class DashboardUtils {
public static DashboardConfigurator CreateDashboardConfigurator(IConfiguration configuration, IFileProvider fileProvider) {
DashboardConfigurator configurator = new DashboardConfigurator();
// ...
IndicatorFactory.Register("Moving average");
return configurator;
}
}
}
Register ChartIndicatorsExtension before the control is rendered to add MovingIndicator type to the Trend Indicators editor.
function onBeforeRender(dashboardControl) {
// ...
dashboardControl.registerExtension(new DevExpress.Dashboard.Designer.ChartIndicatorsExtension(dashboardControl, {
customIndicatorTypes: [ {
type: 'MovingIndicator',
displayName: 'Moving Average'
}
]
}));
}
打开趋势指标编辑器并添加一个新的趋势指标。如果您遵循这个例子,一个新的移动平均类型将在UI中可用: