数据可视化(六)多个子图及seaborn使用
1.多个子图绘制
#绘制多个子图
#subplot(*args,**kwargs)  每个subplot函数只能绘制一个子图
#subplots(nrows,ncols)
#fig_add_subplot(行,列,区域)
#绘制子图第一种方式
plt.subplot(2,2,1)#第一个绘图区域两行两列
#plt.subplot(221)简写方式
plt.plot([1,2,3,4,5],[random.randint(1,10) for i in range(5)])
plt.subplot(2,2,2)#两行两列绘图区的第二个绘图区
plt.plot([1,2,3,4,5],[random.randint(1,10) for i in range(5)],'ro')
plt.subplot(2,1,2)#两行一列  ,第二行绘制
x=[1,2,3,4,5]
y=[random.randint(10,50) for i in range(5)]
plt.bar(x,y)
plt.show()
#绘制的第二种方式
#两行三列的画图区域
#figure画布,axes坐标轴对象
figure,axes=plt.subplots(2,3)
plt.show()
figure,axes=plt.subplots(2,2)
axes[0,0].plot([1,2,3,4,5],[random.randint(1,10) for i in range(5)])
axes[0,1].plot([1,2,3,4,5],[random.randint(1,10) for i in range(5)],'ro')
x=[1,2,3,4,5]
y=[random.randint(10,50) for i in range(5)]
axes[1,0].bar(x,y)
x=[random.randint(10,50) for i in range(5)]
axes[1,1].pie(x,autopct='%1.1f%%')
plt.show()#绘制子图的第三种方式
#绘制画布
fig=plt.figure()
ax1=fig.add_subplot(2,2,1) #两行两列第一个绘图区域
ax1.plot([1,2,3,4,5],[random.randint(1,10) for i in range(5)])
ax2=fig.add_subplot(2,2,2) #两行两列第二个绘图区域
ax2.plot([1,2,3,4,5],[random.randint(1,10) for i in range(5)],'ro')
ax3=fig.add_subplot(2,2,3)
ax3.bar([1,2,3,4,5],[random.randint(1,10) for i in range(5)])
ax4=fig.add_subplot(2,2,4)
ax4.pie([random.randint(1,10) for i in range(5)],autopct='%1.1f%%')
plt.show()2.
#图表的保存
#图表保存格式jpeg,tiff,png
#plt.savefig(图名)
3.seaborn使用,首先安装。如果在pycharm中安装报错,先安装Scipy
import matplotlib.pyplot as plt
import seaborn as sns
#seaborn绘图
#绘制简单柱状图
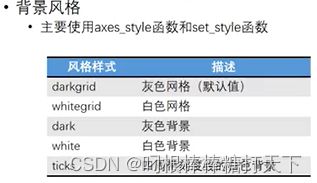
sns.set_style('darkgrid')#设置风格样式
x=[1,2,3,4,5]
y=[20,6,50,9,56]
sns.barplot(x,y)
plt.show()
