echarts图表基本使用
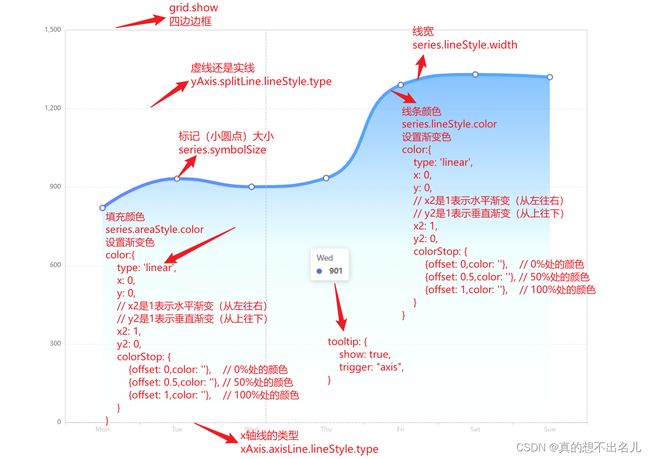
折线图
import * as echarts from 'echarts';

const chartDom = document.getElementById('main');
const myChart = echarts.init(chartDom);
const option = {
  xAxis: {
    type: 'category',
    data: ['Mon', 'Tue', 'Wed', 'Thu', 'Fri', 'Sat', 'Sun']
  },
  yAxis: {
    type: 'value'
  },
  series: [
    {
      data: [820, 932, 901, 934, 1290, 1330, 1320],
      type: 'line',
      smooth: true
    }
  ]
};

option && myChart.setOption(option);
折线图样式设置
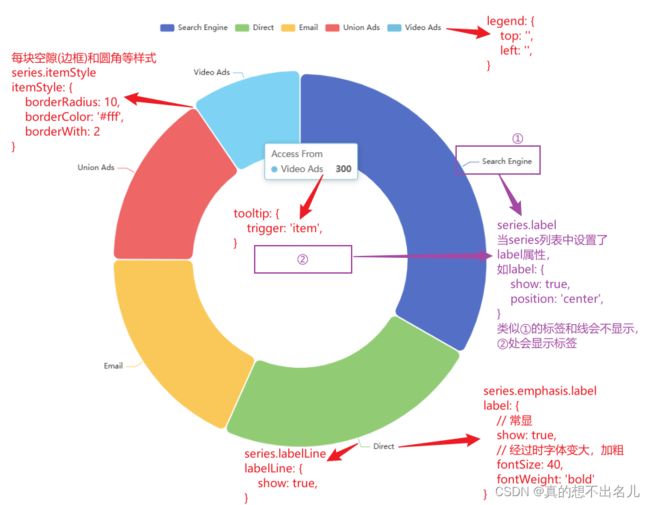
饼图
import * as echarts from 'echarts';

const chartDom = document.getElementById('main');
const myChart = echarts.init(chartDom);
const option = {
  tooltip: {
    trigger: 'item'
  },
  legend: {
    top: '5%',
    left: 'center'
  },
  series: [
    {
      name: 'Access From',
      type: 'pie',
      radius: ['40%', '70%'],
      avoidLabelOverlap: false,
      itemStyle: {
        borderRadius: 10,
        borderColor: '#fff',
        borderWidth: 2
      },
      // label: {
      //   show: false,
      //   position: 'center'
      // },
      emphasis: {
        label: {
          show: true
          // fontSize: 40,
          // fontWeight: 'bold'
        }
      },
      labelLine: {
        show: true
      },
      data: [
        { value: 1048, name: 'Search Engine' },
        { value: 735, name: 'Direct' },
        { value: 580, name: 'Email' },
        { value: 484, name: 'Union Ads' },
        { value: 300, name: 'Video Ads' }
      ]
    }
  ]
};

option && myChart.setOption(option);
饼图样式设置
标题设置
title:{ text: '男生', left:'center', bottom:'80', },
当有多个饼图时,可通过在series列表中添加
center: ['50%','50%']改变饼图位置
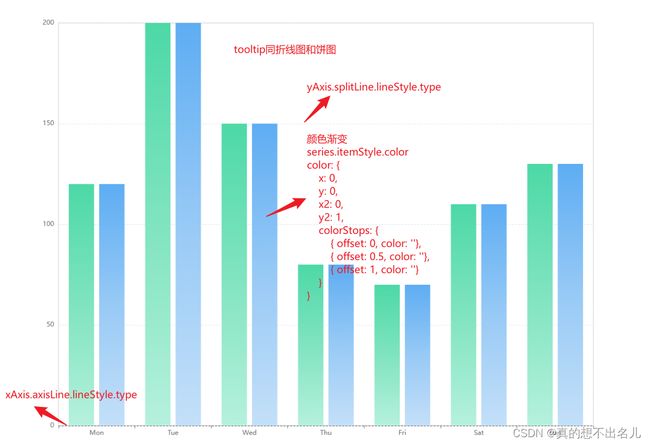
柱状图
import * as echarts from 'echarts';

var chartDom = document.getElementById('main');
var myChart = echarts.init(chartDom);
var option;

option = {
  grid: {
    show: true
  },
  tooltip: {
    show: true
  },
  xAxis: {
    type: 'category',
    data: ['Mon', 'Tue', 'Wed', 'Thu', 'Fri', 'Sat', 'Sun'],
    axisLine: {
      lineStyle: {
        type: 'dashed'
      }
    }
  },
  yAxis: {
    type: 'value',
    splitLine: {
      lineStyle: {
        type: 'dashed'
      }
    }
  },
  series: [
    {
      data: [120, 200, 150, 80, 70, 110, 130],
      type: 'bar',
      itemStyle: {
        color: {
          x: 0,
          y: 0,
          x2: 0,
          y2: 1,
          colorStops: [
            { offset: 0, color: '#4DD9A7' },
            { offset: 0.5, color: '#80E4C0' },
            { offset: 1, color: '#B6F1DD' }
          ],
          global: false
        }
      }
    },
    {
      data: [120, 200, 150, 80, 70, 110, 130],
      type: 'bar',
      itemStyle: {
        color: {
          x: 0,
          y: 0,
          x2: 0,
          y2: 1,
          colorStops: [
            { offset: 0, color: '#5EADF3' },
            { offset: 0.5, color: '#98CAF6' },
            { offset: 1, color: '#C4E0F9' }
          ]
        }
      }
    }
  ]
};

option && myChart.setOption(option);


