我的踩坑记录!!!积累中......
bug记录7:
- 在线ppt编辑问题的解决方案?无图片服务器,支持保存
- 考虑:
1.内嵌:涉及数据安全
2.本地存储:无法解决异步回显 - 解决:html的解决方案
bug记录6:
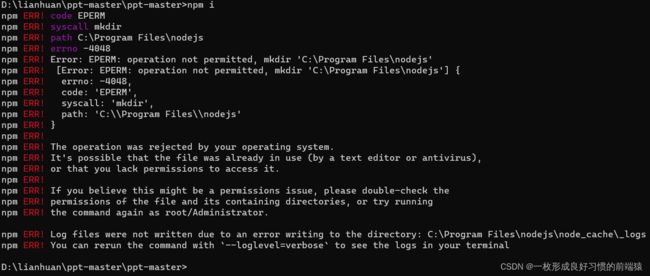
解决
nodejs安装后,在安装目录下【nodejs】创建两个文件夹【node_global】及【node_cache】用来配置全局环境变量。
之后,打开cmd命令窗口,输入
npm config set prefix ”D:\Program Files\nodejs\node_global”
npm config set cache “D:\Program Files\nodejs\node_cache”
bug记录5:
- 初次登陆到dataset页面main内容缺失,控制台标红TypeError: Cannot read properties of null (reading ‘structId’)?
原因:数据格式不匹配
解决:vuex中structId初始化为空对象
bug记录:
- 导航栏跳转时下划线样式丢失问题?Vue如何获取url路由地址和参数?
原因:类名丢失
解决:点击事件本地存储路由或者配置 :default-active=“this.$route.path”,handleSelect函数用不到
      <el-menu router :default-active="this.$route.path" mode="horizontal">
        <el-menu-item index="/set">页面1</el-menu-item>
        <el-menu-item index="/calculation">页面2</el-menu-item>
        <el-menu-item index="/edit">页面3</el-menu-item>
      </el-menu>
- 上测试环境后页面刷新时出现404 not found nginx?
原因:history会把/login当中目录文件请求而不是路由,兼容性不好
解决:将mode: “history”,改为mode: “hash”,用哈希,兼容性好 - 本地构建打包成功,测试环境下不能访问后端服务
请求 URL:http://192.168.212.21:9024/api/captcha/getCode
状态代码:404 Not Found
远程地址:192.168.212.21:9024
原因:跨域并不能解决不同服务器之间的问题。后端为192.168.212.22前端为192.168.212.21
解决:将服务器地址设置一致
bug记录4:
- 页面加载取到vuex中的树形数据渲染,刷新时数据丢失?
原因:vuex存在内存,刷新会丢失
解决:vuex持久化插件存储解决刷新时数据丢失 - 如何监听树行数据的更新和变化?
解决:watch监听函数监听newValue和oldValue - 插槽只显示一个问题?
原因:插槽位只有一个
解决:
<!-- slot="trigger" -->
 <el-upload class="upload" action="http://192.168.222.22:8074/import/upload" :headers="headers" :limit="1" ref="upload" :on-exceed="handleExceed" :file-list="fileList" :on-success="uploadSuccess" :before-upload="beforeAvatarUpload" accept="files">
    <i :class="{ 'add_icon': data.id !== null && data.isDirectory == 1 }" slot="trigger" size="small" type="primary"></i>
 </el-upload>
bug记录3:
- 本地没问题-测试环境验证码404-修改/api-出了验证码-login请传token?
解决:请求路径中的api为webpack代理,开发环境存在,测试和生产环境无 - 本地没问题-测试环境报请传token(后端)-测试环境ok
解决:本次拿到的验证码为上次的,需要后端验证码存储方式变为radies
bug记录2:
- 关于搜索时树节点全部展开,搜索到的数据标红和无搜索词时树节点全部折叠问题?解决如下:
1. :default-expand-all="defaultExpand" :filter-node-method="filterNode"
2. defaultExpand: false,
3.  filterNode(filterText, data) {
      if (filterText) {
        this.defaultExpand = true
        this.changeTreeNodeStatus(this.$refs.tree.store.root)
        return true
      } else {
        this.defaultExpand = false
        this.changeTreeNodeStatus(this.$refs.tree.store.root)
      }
      return data.name.indexOf(filterText) !== -1;
    },
    changeTreeNodeStatus(node) {
      console.log(node)
      node.expanded = this.defaultExpand
      for (let i = 0; i < node.childNodes.length; i++) {
        // 改变节点的自身expanded状态
        node.childNodes[i].expanded = this.defaultExpand
        // 遍历子节点
        if (node.childNodes[i].childNodes.length > 0) {
          this.changeTreeNodeStatus(node.childNodes[i])
        }
      }
    },
4.   watch: {
    filterText(filterText) {
      console.log(filterText);
      this.$refs.tree.filter(filterText);
    },
  },
bug记录1:
- 设计饼状图点击具体色块时颜色选择器出现位置问题?
解决:思路1:获取到具体色块的位置计算中心点
    handleChartClick(params) {
      // 处理饼状图点击事件的逻辑
      console.log('点击了饼状图', params)
      // 获取点击区域的颜色
      const color = params.color
      // 更新选中的颜色
      // this.selectedColor = color
      console.log(this.showPicker)
      // 弹出颜色选择器
      this.showPicker = true
      console.log(this.showPicker)


      // this.selectedColor = color

      // const containerRect = this.$refs.chart.getBoundingClientRect()
      // const index = params.dataIndex
      // const pieRect = this.getPieRect(index)
      // const pickerWidth = 560
      // const pickerHeight = 400
      // const pickerLeft = containerRect.left + (pieRect.x2 + pieRect.x4) / 2 - pickerWidth / 2
      // const pickerTop = containerRect.top + (pieRect.y2 + pieRect.y4) / 2 - pickerHeight / 2

      // this.pickerStyle = {
      //   left: pickerLeft + 'px',
      //   top: pickerTop + 'px'
      // }

    },
    getPieRect(index) {
      const chartInstance = echarts.getInstanceByDom(this.$refs.chart)
      const series = chartInstance.getOption().series[0]
      // console.log(series)
      const dataIndex = series.data[index].name


      const angle = 2 * Math.PI / series.data.length
      const startAngle = -Math.PI / 2 + index * angle
      const endAngle = startAngle + angle

      const radius = Math.min(chartInstance.getWidth(), chartInstance.getHeight()) / 2
      const centerX = chartInstance.getWidth() / 2
      const centerY = chartInstance.getHeight() / 2

      const outerRadius = radius - 10
      const innerRadius = 0

      const x1 = centerX + outerRadius * Math.cos(startAngle)
      const y1 = centerY + outerRadius * Math.sin(startAngle)

      const x2 = centerX + innerRadius * Math.cos(startAngle)
      const y2 = centerY + innerRadius * Math.sin(startAngle)

      const x3 = centerX + innerRadius * Math.cos(endAngle)
      const y3 = centerY + innerRadius * Math.sin(endAngle)

      const x4 = centerX + outerRadius * Math.cos(endAngle)
      const y4 = centerY + outerRadius * Math.sin(endAngle)
      console.log(x1, y1, x2, y2, x3, y3, x4, y4)

      return { x1, y1, x2, y2, x3, y3, x4, y4 }
    },
解决:思路2:获取到数据点击具体色块的位置计算中心点,
    updatePicker(val) {
      document.getElementById('charts').removeEventListener('mousemove', this.handleMouseMove)
      console.log(222, val, '新颜色=', val.hex)
      // 使用 $set 方法来更新数组中指定索引的元素 this.$set(this.colors, this.dataIndex, val.hex);
      // this.$set(this.colors, this.dataIndex, val.hex);
      const colindex = this.dataIndex
      const newcolor = val.hex
      this.colors.splice(colindex, 1, newcolor);
      this.$forceUpdate();
      this.generateChart()
      // this.colors[this.dataIndex] = val.hex
    },