【Python小demo】JOJO替身面板生成
文章目录
- 1 前言
- 2 代码实现
- 3 总结
1 前言
最近暑假在数模研赛备赛,情理之中地接触了一些图表。也是第一次才知道雷达图这么个图表形式,用于直观地评价多个变量或指标。看到雷达图,我不禁联想到了JOJO中的替身面板,于是兴起想用Python的matplotlib库绘制一下。
2 代码实现
直接上代码,对matplotlib库了解得不太深入,因此写得有点冗余。
下面是直接从备赛代码中拿出的雷达图绘制类:
# 雷达图绘制类
class RadarChart:
    def __init__(self, radar_data, label, category = None):
        self.data = radar_data
        self.label = label
        self.category = category
        self.initial()

    def initial(self):
        colors = list(mcolors.TABLEAU_COLORS.keys())  # 颜色变化
        self.fig = plt.figure(figsize = (5, 5), dpi = 100)  # 建立画布
        self.ax = self.fig.add_subplot(111, polar = True)  # 增加子网格,注意polar参数,极坐标
        angles = np.linspace(0, 2 * np.pi, len(self.label), endpoint = False)  # 计算各个区间的角度
        self.angles = np.concatenate((angles, [angles[0]]))  # 建立相同首尾字段以便于闭合
        self.datas = np.concatenate((self.data, self.data[:, 0].reshape(-1, 1)), axis = 1)  # 建立相同首尾字段以便于闭合
        for i in range(len(self.datas)):
            self.line, = self.ax.plot(self.angles, list(self.datas[i]), 'o-', c = 'deeppink', markersize = 3,
                                      linewidth = 3,
                                      label = self.category[i])  # 画线
            self.fill, = self.ax.fill(self.angles, list(self.datas[i]), alpha = 0.5, c = 'hotpink')
        # 设置图像显示格式
        self.ax.set_thetagrids(angles * 180 / np.pi, self.label)  # 设置极坐标轴
        # self.ax.set_title(self.category[0])  # 设置标题放置
        self.ax.set_rlim(0, np.max(self.data))  # 设置坐标轴尺度范围
        plt.legend(loc = "upper right", bbox_to_anchor = (1.2, 1.0))  # 设置图例位置

    def draw(self, save = False):
        if save:
            plt.savefig(u'radar_chart.png')
        plt.show()

    def export_data(self, fn = 'radar_data.csv'):
        pd.DataFrame(self.data, index = list(range(4)), columns = list(self.label)).to_csv(fn, index = False,encoding = 'utf-8-sig')
派生一个用于绘制JOJO替身面板的子类。
class JOJOPanel(RadarChart):
    def __init__(self, _character, _panel):
        self.character = _character
        self.panel = _panel
        self.value_map = ['F', 'E', 'D', 'C', 'B', 'A']
        _data = np.array(list(map(lambda x: self.value_map.index(x), self.panel.values()))).reshape(1, -1)
        _labels = list(self.panel.keys())
        super().__init__(_data, _labels, self.character)
        self.ax.patch.set_facecolor('gold')
        self.ax.patch.set_alpha(0.5)
        self.ax.grid(True)  # 是否显示网格
        self.ax.set_theta_zero_location('SE')  # 0°可设置在八个位置,分别为N, NW, W, SW, S, SE, E, NE
        self.ax.set_rlabel_position(180)  # 设置极径标签显示位置(角度)
        # self.ax.set_rticks(np.arange(0, 0))  # 设置极径网格线的显示范围
        self.ax.set_rlim(0, 6)  # 设置显示的极径范围
        # self.ax.set_rgrids([0, 1, 2, 3, 4, 5])  # 设置极径网格线显示,参数为所要显示网格线的极径值列表
        self.ax.get_legend().remove()  # 删除图例
这样就写完了!我们看看效果如何,尝试绘制一下黄金体验的替身面板。
character = ["Gold Experience"]
panel = {"破坏力": 'C',
         "成长性": 'A',
         "精密动作性": 'C',
         "速度": 'A',
         "射程": 'C',
         "持续性": 'D'}
jp = JOJOPanel(character, panel)
jp.draw()
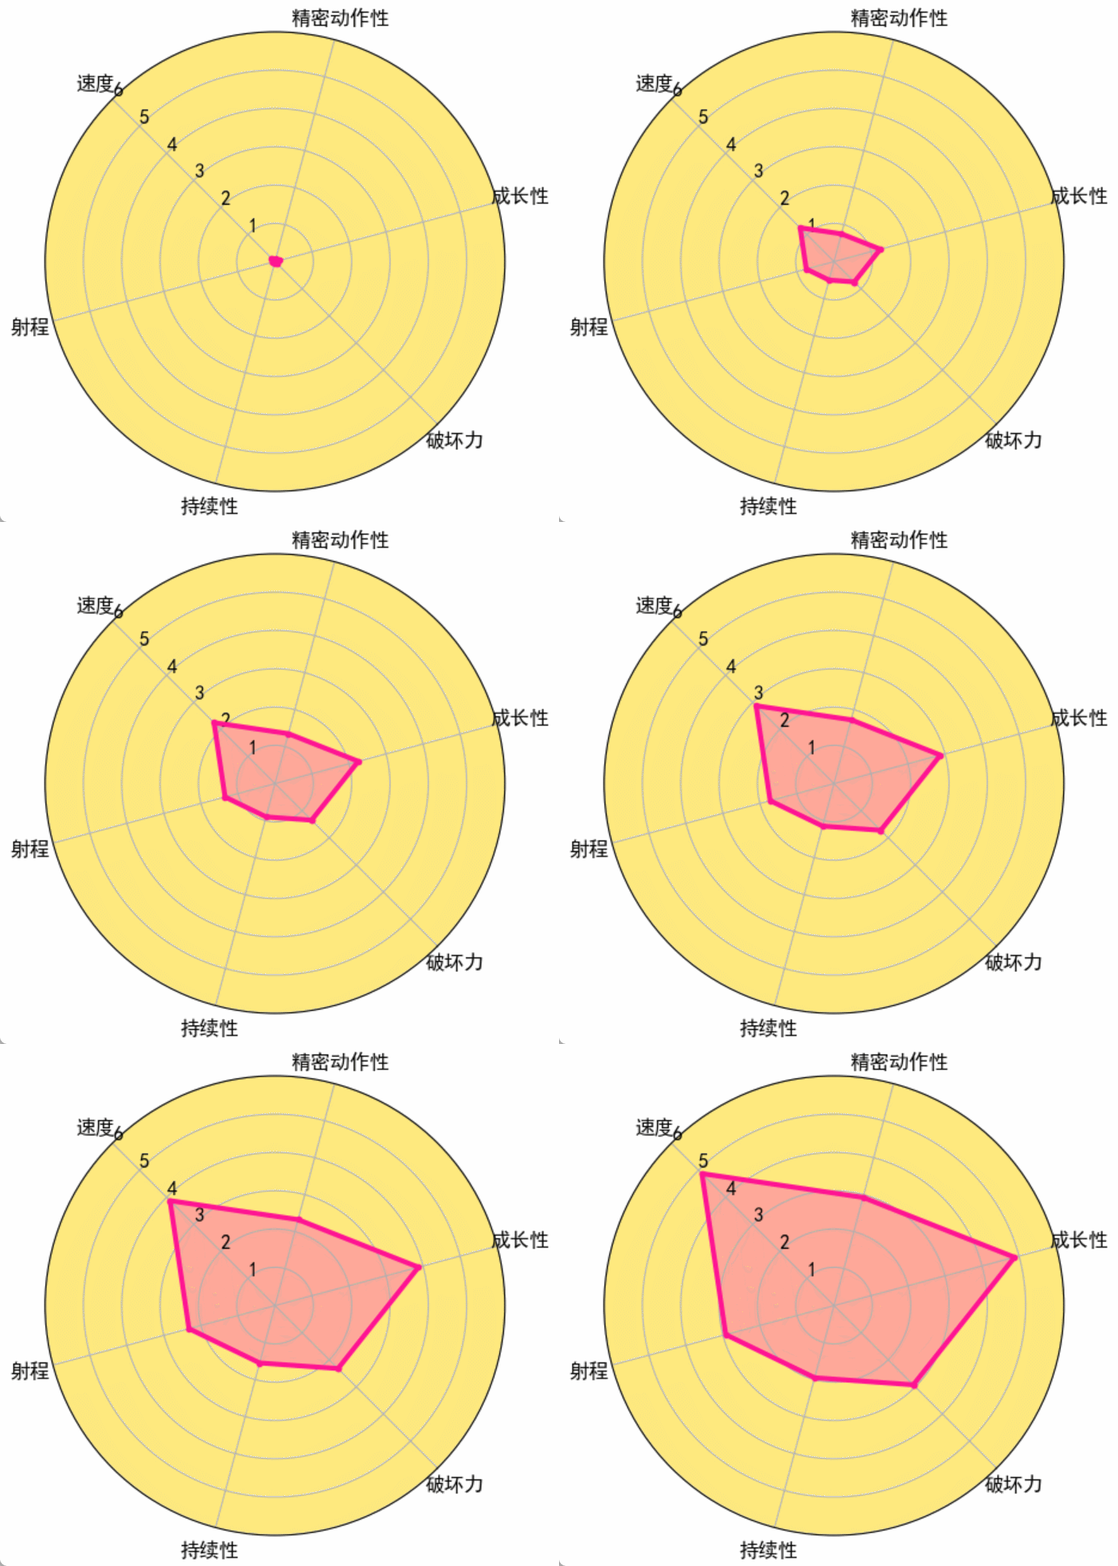
运行效果如下:

为了还原剧中的动态绘制效果,我们直接from matplotlib.animation import FuncAnimation,进行动态绘制。我们继续在JOJOPanel类中添加一个draw_dynamic函数。
def draw_dynamic(self, frame: int = None, method = 'accel'):
     if frame is None:
         frame = len(self.value_map)

     # 运动方程
     def motion(t):
         s = 0
         if method == 'accel':  # 加速度变化,匀减速
             S = 1
             v0 = (2 * S) / frame
             a = -v0 / frame
             s = v0 * t + 0.5 * a * t * t
         else:  # 线性变化
             v = 1 / frame
             s = v * t
         return s

     def init():
         y = self.datas * 0
         self.line.set_data(self.angles, y)  # 设置初始 x,y
         self.fill.set_xy(np.concatenate((self.angles.reshape(-1, 1), y.reshape(-1, 1)), axis = 1))
         return self.line

     def update(step):
         cur_t = step + 1
         y = self.datas * motion(cur_t)
         self.line.set_data(self.angles, y)  # 设置新的 x,y
         self.fill.set_xy(np.concatenate((self.angles.reshape(-1, 1), y.reshape(-1, 1)), axis = 1))
         return self.line

     ani = FuncAnimation(self.fig, update, frames = frame, interval = 1, blit = False,
                         repeat = False, init_func = init)  # 创建动画效果
     plt.show()  # 显示图片

上面的动画是一个线性变化的过程,看起来没有剧中的那么自然,有点生硬。于是我加了一个匀减速运动方程,效果如下:

左边是线性变化,右边是匀减速变化。
3 总结
最终效果只是部分还原,就这样啦~