echarts 图表饼状图 实例

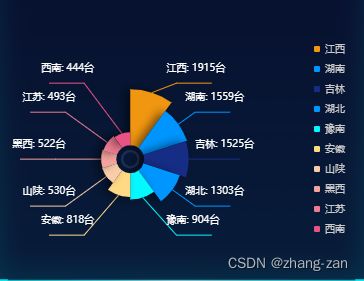
效果图:

echarts 图表饼状图 实例_第1张图片

代码: 

draw(data1, data2) {
        var option = {
            // backgroundColor: 'rgb(10,36,68)',
            color: [
                '#F19611 ',
                '#0095FE',
                '#162D86',
                '#0096FF',
                '#05F8FF',
                '#FFD985',
                '#FACDAA',
                '#F4A49E',
                '#EE7B91',
                '#E85285',
                '#BE408C',
                '#942D93',
                '#171E6D',
                '#1E3388',
                '#27539B',
                '#3073AE',
                '#3993C2',
                '#42B3D5',
                '#75C6D1',
                '#75C6D1',
                '#A9DACC',
                '#A9DACC',
                '#D2EDC8',
                '#E2F8DA',
            ],
            grid: {
                left: '2%',
                top: '10%',
                bottom: '1%',
                right: '1%',
                containLabel: true,
            },

            legend: {
                orient: 'vertical',
                top: 8,
                right: 0,
                height: 240,
                itemWidth: 6, //修改icon图形大小
                itemHeight: 6, //修改icon图形大小
                textStyle: {
                    fontSize: 10,
                    color: '#CACACA',
                },
                data: data1,
            },
            calculable: true,
            series: [
                {
                    type: 'pie',
                    radius: ['6%', '8%'],
                    center: ['35%', '55%'],
                    hoverAnimation: false,
                    labelLine: {
                        normal: {
                            show: false,
                        },
                        emphasis: {
                            show: false,
                        },
                    },
                    data: [
                        {
                            name: '',
                            value: 0,
                            itemStyle: {
                                normal: {
                                    color: '#202F57 ',
                                },
                            },
                        },
                    ],
                },

                {
                    stack: 'a',
                    type: 'pie',
                    radius: ['12%', '60%'],
                    center: ['35%', '55%'],
                    roseType: 'area',
                    zlevel: 10,
                    label: {
                        normal: {
                            formatter: '{b}: {c}台',
                            borderWidth: 0,
                            borderRadius: 4,
                            padding: [0, -50],
                            height: 40,
                            fontSize: 10,
                            align: 'center',
                            rich: {
                                b: {
                                    fontSize: 10,
                                    lineHeight: 5,
                                    color: '#41B3DC',
                                },
                            },
                            color: '#fff',
                        },
                    },
                    labelLine: {
                        normal: {
                            show: true,
                            length: 10,
                            length2: 35,
                        },
                        emphasis: {
                            show: false,
                        },
                    },
                    itemStyle: {
                        normal: {
                            // 设置扇形的阴影
                            shadowBlur: 10,
                            shadowColor: 'rgb(0,0,0,.5)',
                            shadowOffsetX: -5,
                            // shadowOffsetY: 5
                        },
                    },
                    data: data2,
                },
            ],
        };

        window.addEventListener('resize', () => {
            this.myChart.resize();
        });
        this.myChart.setOption(option);
    }
你可能感兴趣的:(echarts,echarts)