Docker运行Prometheus(普罗米修斯),grafana,springboot整合
1.编辑yaml格式,进行自我监控
# mkdir /etc/prometheus
# cd /etc/prometheus/

# vi /etc/prometheus/prometheus.yml
# my global config
global:
  scrape_interval:     15s # Set the scrape interval to every 15 seconds. Default is every 1 minute.
  evaluation_interval: 15s # Evaluate rules every 15 seconds. The default is every 1 minute.
  # scrape_timeout is set to the global default (10s).

# Alertmanager configuration
alerting:
  alertmanagers:
  - static_configs:
    - targets:
      # - alertmanager:9093

# Load rules once and periodically evaluate them according to the global 'evaluation_interval'.
rule_files:
  # - "first_rules.yml"
  # - "second_rules.yml"

# A scrape configuration containing exactly one endpoint to scrape:
# Here it's Prometheus itself.
scrape_configs:
  - job_name: 'prometheus'
    static_configs:
    - targets: ['127.0.0.1:9090']
###以下内容为SpringBoot应用配置
  - job_name: 'api'
    scrape_interval: 5s
    metrics_path: '/actuator/prometheus'
    static_configs:
      - targets: ['172.16.168.105:8080']
2.运行Docker的prometheus(普罗米修斯)容器
docker run -p 9090:9090 -v /etc/prometheus/prometheus.yml:/etc/prometheus/prometheus.yml prom/prometheus
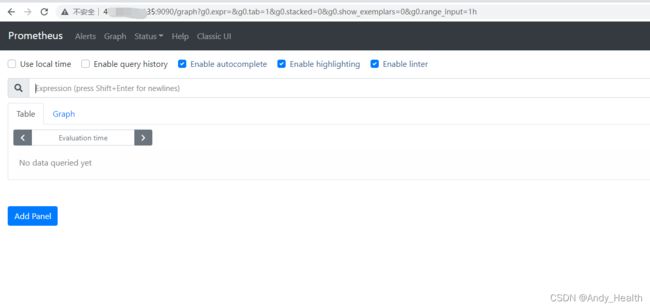
3.打开浏览器 ,输入ip:9090
2. docker安装grafana
参考:https://www.cnblogs.com/xiao987334176/p/9930517.html
新建空文件夹grafana-storage,用来存储数据
mkdir /opt/grafana-storage
设置权限
chmod 777 -R /opt/grafana-storage
启动grafana
docker run -d -p 3000:3000 --name=grafana -v /opt/grafana-storage:/var/lib/grafana grafana/grafana
默认会先跳转到登录页面,默认的用户名和密码都是admin
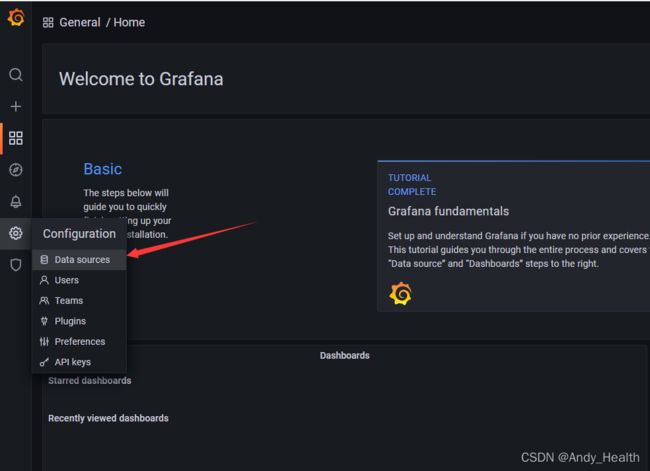
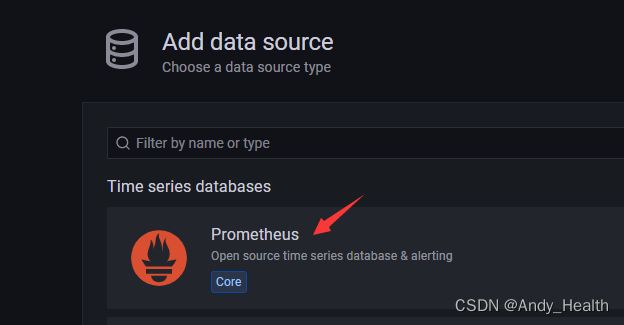
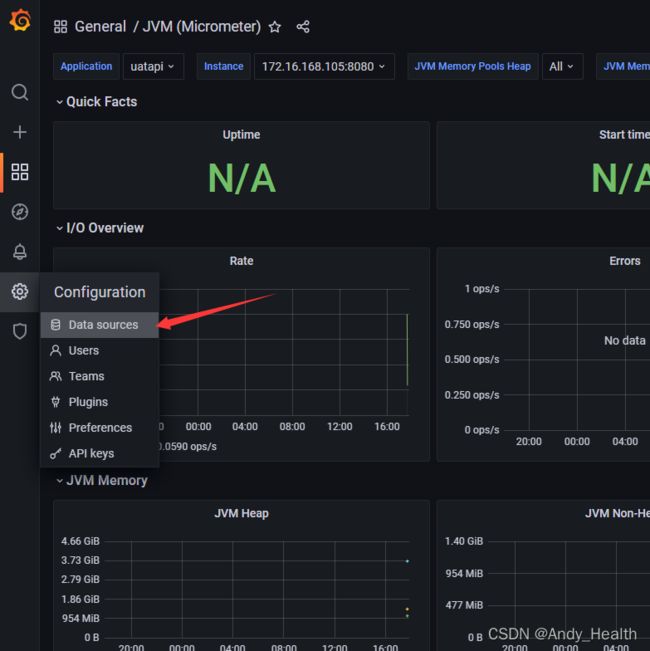
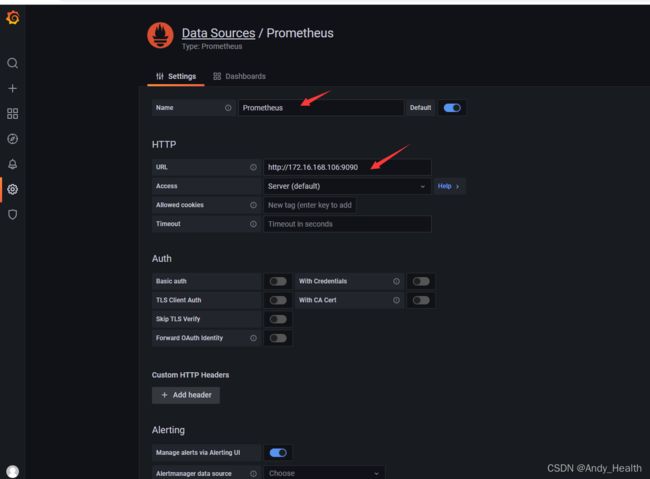
创建数据源
2. 配置邮箱smtp
将配置文件拷贝到宿主机
docker cp grafana:/etc/grafana/grafana.ini /opt/grafana-storage/
[smtp]
# 启用 smtp
enabled = true
# 腾讯企业邮件服务器地址和端口
host = smtpdm.aliyun.com:80
# 账号
user =  XXX@qq.com
# If the password contains # or ; you have to wrap it with triple quotes. Ex """#password;"""
# 密码
password = password
cert_file =
key_file =
# 忽略 SSL 认证
skip_verify = true
from_address = XXX@qq.com
from_name = Grafana
ehlo_identity =
删除grafana
docker stop grafana
docker rm grafana
重启挂载文件
docker run -d -p 3000:3000 --name=grafana -v /opt/grafana-storage:/var/lib/grafana -v /opt/grafana-storage/grafana.ini:/etc/grafana/grafana.ini grafana/grafana
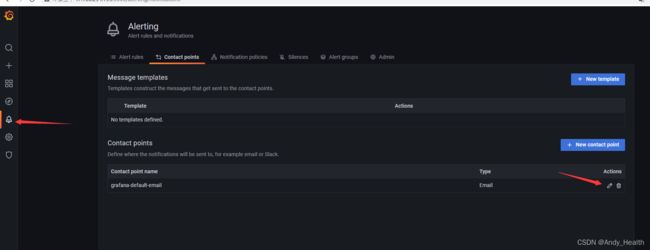
修改邮箱


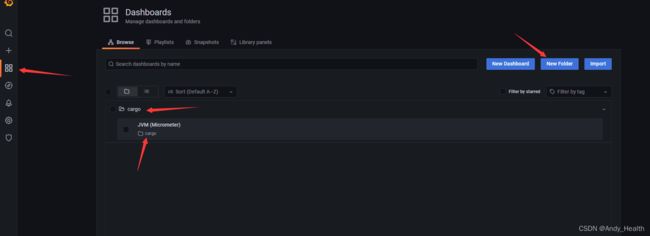
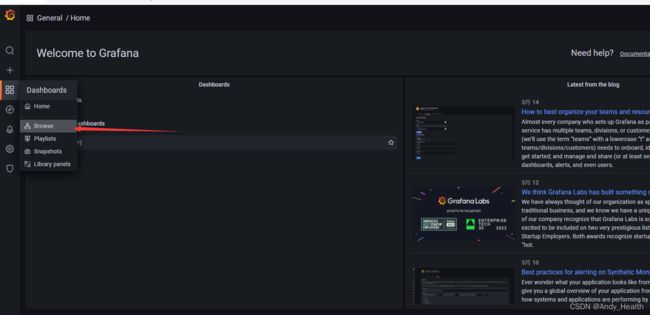
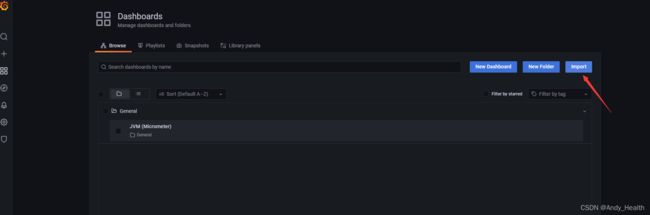
需要创建一个folder,把jvm放到folder里面

配置邮件发送频率

监控项目jvm
参考:https://blog.csdn.net/weixin_34240520/article/details/92074929
第一步:
mvn的pom.xml引入actuator、prometheus、micrometer
<dependency>
    <groupId>org.springframework.boot</groupId>
    <artifactId>spring-boot-starter-actuator</artifactId>
</dependency>

<dependency>
    <groupId>io.micrometer</groupId>
    <artifactId>micrometer-registry-prometheus</artifactId>
    <version>1.0.6</version>
</dependency>

<dependency>
    <groupId>io.github.mweirauch</groupId>
    <artifactId>micrometer-jvm-extras</artifactId>
    <version>0.1.2</version>
</dependency>
第二步:
在application.properties配置中,添加prometheus相关配置
# 暴露监控端点
management:
  #prometheus+grafana+springboot2监控集成配置
  endpoints:
    web:
      exposure:
        include: '*'
    prometheus:
      enabled: true
  metrics:
    export:
      prometheus:
        enabled: true
        step: 1ms
        descriptions: true
    tags:
      application: ${spring.profiles}-${spring.application.name}
  #prometheus+grafana+springboot2监控集成配置
第三步:
修改prometheus.yml,添加job添加下面代码,其中xxx替换为项目启动路径。
然后再启动prometheus,访问http://localhost:9090,查看targets启动是否正常如下图
# my global config
global:
  scrape_interval:     15s # Set the scrape interval to every 15 seconds. Default is every 1 minute.
  evaluation_interval: 15s # Evaluate rules every 15 seconds. The default is every 1 minute.
  # scrape_timeout is set to the global default (10s).

# Alertmanager configuration
alerting:
  alertmanagers:
  - static_configs:
    - targets:
      # - alertmanager:9093

# Load rules once and periodically evaluate them according to the global 'evaluation_interval'.
rule_files:
  # - "first_rules.yml"
  # - "second_rules.yml"

# A scrape configuration containing exactly one endpoint to scrape:
# Here it's Prometheus itself.
scrape_configs:
#  - job_name: 'prometheus'
#    static_configs:
#    - targets: ['127.0.0.1:9090']
###以下内容为SpringBoot应用配置
  - job_name: 'uat-api'
    scrape_interval: 5s
    metrics_path: '/actuator/prometheus'
    static_configs:
      - targets: ['172.16.168.105:8080']

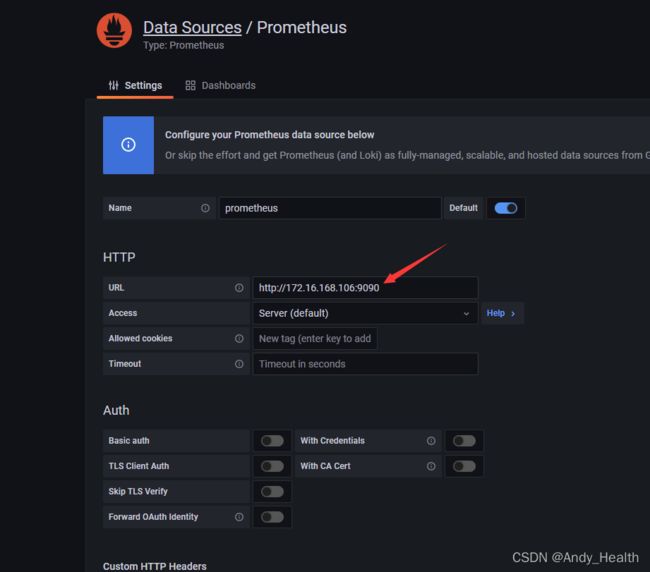
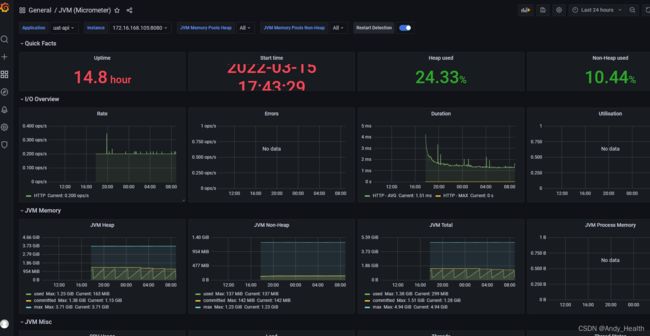
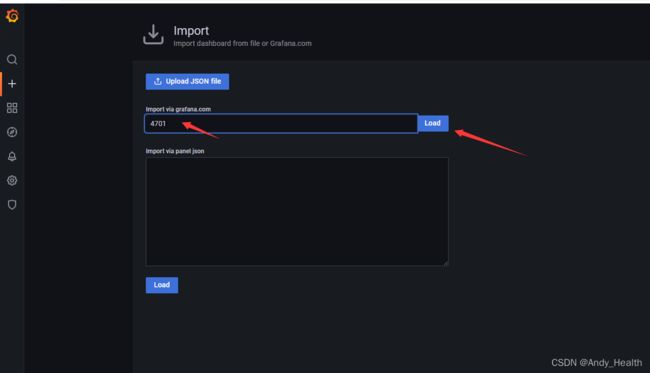
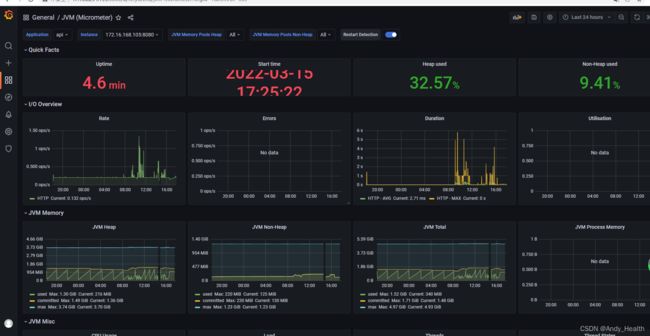
第四步: 安装Grafana,默认启动后Grafana地址为:http://localhost:3000/,登录用户名和密码是admin/admin,配置prometheus为database如下图一所示,import配置grafana id = 4701jvm使用情况面板如图

配置数据源:
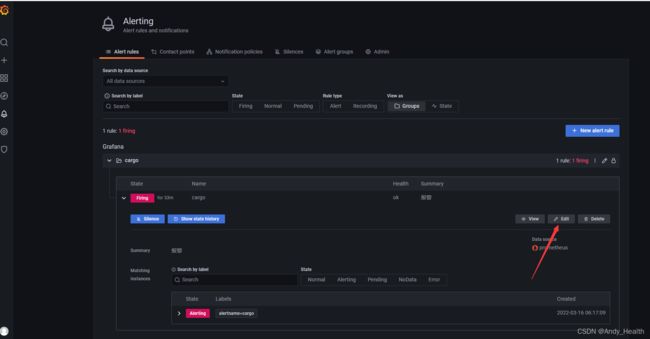
docker安装altermanager
参考:https://blog.csdn.net/weixin_43296313/article/details/117323222
docker run -d --name alertmanager -p 9093:9093 -v /etc/prometheus/alertmanager.yml:/etc/alertmanager/alertmanager.yml prom/alertmanager:latest
vim alertmanager.yml
global:
# 在没有报警的情况下声明为已解决的时间
  resolve_timeout: 5m
# 配置邮件发送信息
  smtp_smarthost: 'smtpdm.aliyun.com:80'
  smtp_from: '[email protected]'
  smtp_auth_username: '[email protected]'
  smtp_auth_password: '******'
  smtp_hello: 'system@****go.com'
  smtp_require_tls: false

templates:
  - '/etc/prometheus/email.tmpl'

  # 所有报警信息进入后的根路由,用来设置报警的分发策略
route:
# 这里的标签列表是接收到报警信息后的重新分组标签,例如,接收到的报警信息里面有许多具有 cluster=A 和 alertname=LatncyHigh 这样的标签的报警信息将会批量被聚合到一个分组里面
  group_by: ['alertname', 'cluster']
# 当一个新的报警分组被创建后,需要等待至少group_wait时间来初始化通知,这种方式可以确保您能有足够的时间为同一分组来获取多个警报,然后一起触发这个报警信息。
  group_wait: 30s

# 当第一个报警发送后,等待'group_interval'时间来发送新的一组报警信息。
  group_interval: 5m

 # 如果一个报警信息已经发送成功了,等待'repeat_interval'时间来重新发送他们
  repeat_interval: 5m

# 默认的receiver:如果一个报警没有被一个route匹配,则发送给默认的接收器
  receiver: email  # 优先使用default发送

receivers:
- name: 'email'
  email_configs:
  - to: '97****[email protected]'
    send_resolved: true
配置其他内容,看参考文章!