波士顿房价预测
波士顿房地产市场竞争激烈,而你想成为该地区最好的房地产经纪人。为了更好地与同行竞争,你决定运用机器学习的一些基本概念,帮助客户为自己的房产定下最佳售价。幸运的是,你找到了波士顿房价的数据集,里面聚合了波士顿郊区包含多个特征维度的房价数据。你的任务是用可用的工具进行统计分析,并基于分析建立优化模型。这个模型将用来为你的客户评估房产的最佳售价。
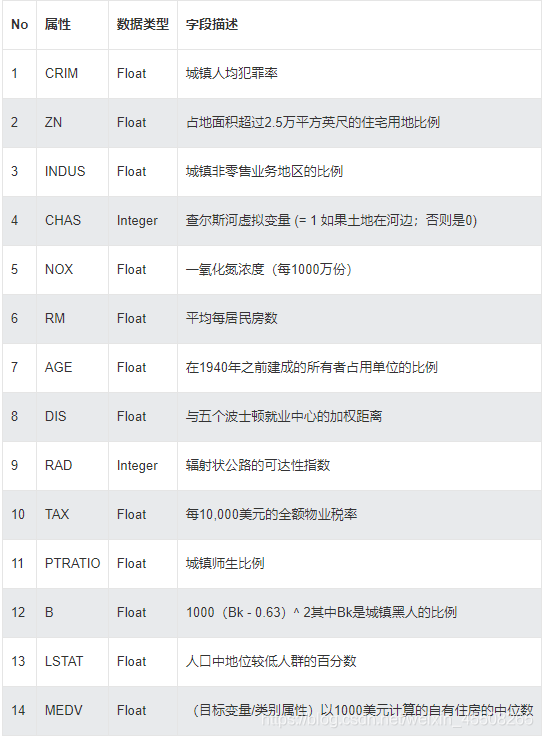
数据集介绍
导入包
import pandas as pd
import numpy as np
import seaborn as sns
from sklearn.preprocessing import StandardScaler
from sklearn.model_selection import train_test_split
from sklearn.ensemble import AdaBoostRegressor, RandomForestRegressor, GradientBoostingRegressor
from sklearn.model_selection import cross_val_score, GridSearchCV, cross_validate
from sklearn.neighbors import KNeighborsRegressor
from sklearn.linear_model import LinearRegression
from sklearn.svm import SVR
from sklearn.tree import DecisionTreeRegressor
import matplotlib.pyplot as plt
读取数据
boston_dataset = pd.read_csv("boston_housing.csv", delimiter="\t", )
boston_dataset.head(3)
|
CRIM |
ZN |
INDUS |
CHAS |
NOX |
RM |
AGE |
DIS |
RAD |
TAX |
PTRATIO |
B |
LSTAT |
MEDV |
| 0 |
0.00632 |
18.0 |
2.31 |
0 |
0.538 |
6.575 |
65.2 |
4.0900 |
1 |
296 |
15.3 |
396.90 |
4.98 |
24.0 |
| 1 |
0.02731 |
0.0 |
7.07 |
0 |
0.469 |
6.421 |
78.9 |
4.9671 |
2 |
242 |
17.8 |
396.90 |
9.14 |
21.6 |
| 2 |
0.02729 |
0.0 |
7.07 |
0 |
0.469 |
7.185 |
61.1 |
4.9671 |
2 |
242 |
17.8 |
392.83 |
4.03 |
34.7 |
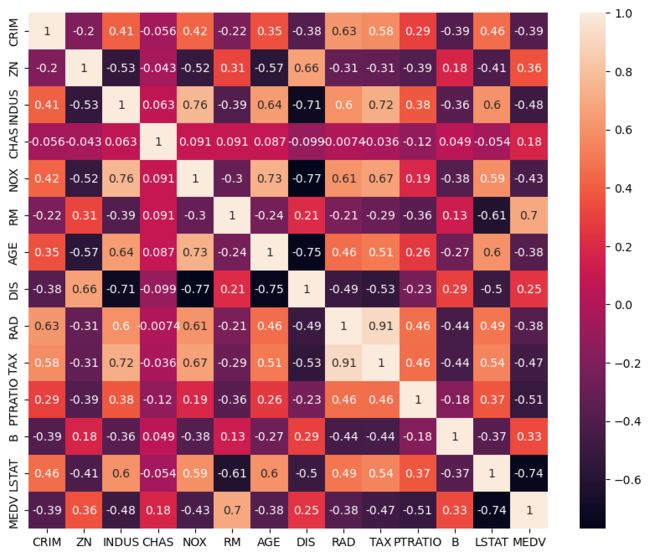
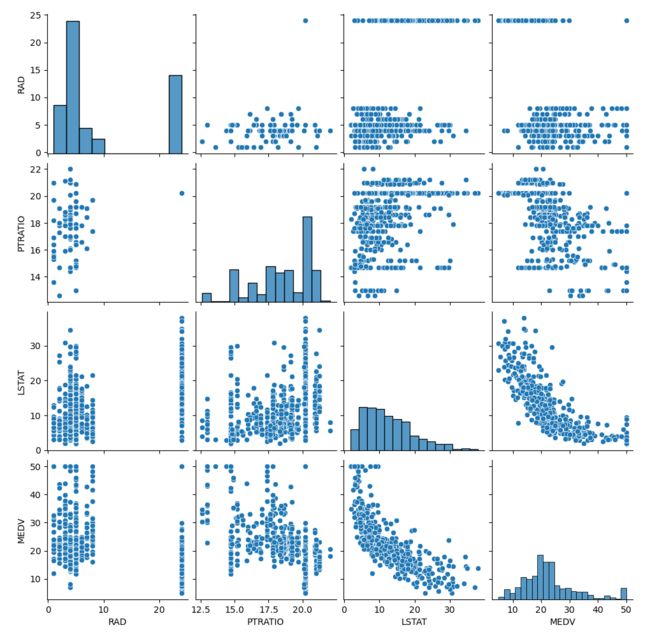
相关性检验
plt.figure(figsize=(10,8))
sns.heatmap(boston_dataset.corr(), annot=True)
sns.pairplot(boston_dataset, vars=["CRIM","ZN","INDUS","CHAS","NOX","RM","AGE","DIS","RAD","TAX","PTRATIO","B","LSTAT","MEDV"])
划分数据集
ss = StandardScaler()
num_columns = boston_dataset.columns[0:-1]
X = ss.fit_transform(boston_dataset[num_columns])
y = boston_dataset["MEDV"].to_numpy()
X_train, X_test, y_train, y_test = train_test_split(X, y, test_size=0.2)
print(X_train.shape, X_test.shape, y_train.shape, y_test.shape)
(404, 13) (102, 13) (404,) (102,)
模型选择
svm_model = SVR()
knn_model = KNeighborsRegressor(n_neighbors=3)
lr_model = LinearRegression()
dt_model = DecisionTreeRegressor()
adaboost_model = AdaBoostRegressor()
rf_model = RandomForestRegressor()
gbdt_model = GradientBoostingRegressor()
model_list = [svm_model, knn_model, lr_model, dt_model, adaboost_model, rf_model, gbdt_model]
scores_df = pd.DataFrame()
for i, model in enumerate(model_list):
scores = cross_val_score(model, X, y, cv=5)
scores_df.loc[i, "mean_score"] = np.mean(scores)
scores_df.index = pd.Series(
["svm_model", "knn_model", "lr_model", "dt_model", "adaboost_model", "rf_model", "gbdt_model"])
scores_df
|
mean_score |
| svm_model |
0.270768 |
| knn_model |
0.457022 |
| lr_model |
0.353276 |
| dt_model |
0.161991 |
| adaboost_model |
0.575771 |
| rf_model |
0.630923 |
| gbdt_model |
0.680006 |
参数调优
param_list = np.arange(start=10, stop=100, step=20, dtype=np.int64)
param_test = {"n_estimators": param_list,"max_depth": param_list}
gsearch = GridSearchCV(estimator=RandomForestRegressor(), param_grid=param_test, cv=3)
gsearch.fit(X, y)
gsearch.best_params_, gsearch.best_score_
({'max_depth': 30, 'n_estimators': 10}, 0.5695856170057815)
模型评估(随机森林vs线性回归)
rf_model = RandomForestRegressor(n_estimators=gsearch.best_params_["n_estimators"], max_depth=gsearch.best_params_["max_depth"], n_jobs=-1, random_state=47)
rf_model.fit(X_train, y_train)
print(rf_model.score(X_train, y_train))
print(rf_model.score(X_test, y_test))

lr_model = LinearRegression()
lr_model.fit(X_train, y_train)
print(lr_model.score(X_train, y_train))
print(lr_model.score(X_test, y_test))
0.9558480053735636
0.8634121285433521
0.7398903643970363
0.7306972896584056
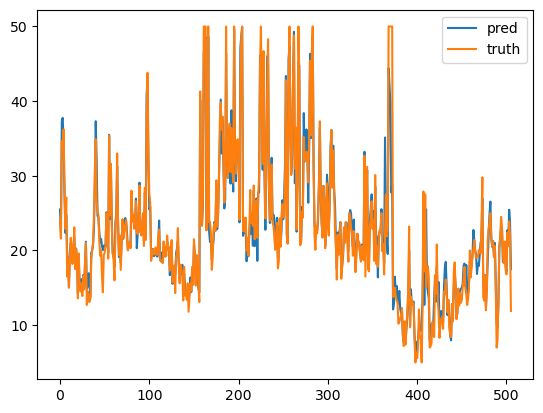
y_pred = rf_model.predict(X)
pred_truth = pd.DataFrame()
pred_truth["pred"]=y_pred
pred_truth["truth"]=y
pred_truth.plot()
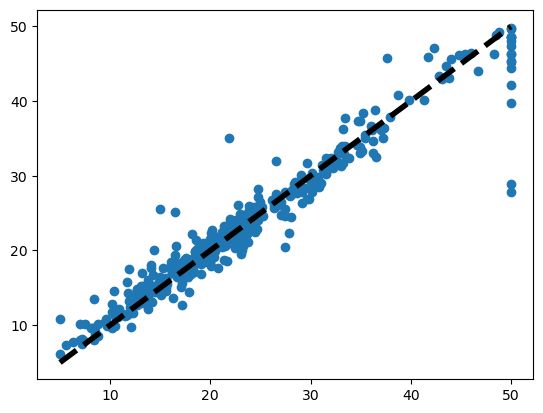
plt.scatter(y, y_pred,label='y')
plt.plot([y.min(), y.max()], [y.min(), y.max()], 'k--', lw=4,label='predicted')
[]
