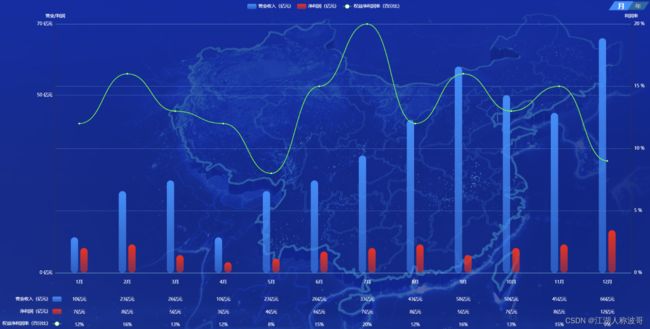
效果图

完整配置
data(){
return{
chart1:null,
chartType1:'1',
data:{
years:{
date:['2015','2016','2017','2018','2019','2020','2021','2022','2023'],
business:[10,23,26,33,43,58,50,45,66],
profit:[3,4,6,7,8,5,7,8,12],
proportion:[12,8,15,20,12,16,13,15,9]
},
months:{
date:['1月', '2月','3月', '4月','5月', '6月','7月', '8月','9月', '10月','11月', '12月'],
business:[10,23,26,10,23,26,33,43,58,50,45,66],
profit:[7,8,5,3,4,6,7,8,5,7,8,12],
proportion:[12,16,13,12,8,15,20,12,16,13,15,9]
}
},
}
},
methods:{
initChart1(){
if (!this.chart1) {
this.chart1 = echarts.init(document.getElementById('chart1'));
}
let data = this.chartType1==='1'?this.data.months:this.data.years
let xData = data.date
let data1 = data.business
let data2 = data.profit
let data3 = data.proportion
let option = {
color:['#00FF00'],
tooltip: {
trigger: 'axis',
axisPointer: {
type: 'cross',
crossStyle: {
color: '#999'
}
}
},
grid: {
top: '60',
left: '100',
right: '12',
bottom: '90',
containLabel: true
},
legend: [
{
textStyle: { color: '#fff' },
data: ['营业收入(亿元)', '净利润(亿元)', '权益净利润率(百分比)']
},
{
align: 'right',
itemGap: 20,
orient: 'vertical',
textStyle: { color: '#fff' },
bottom: 8,
left: 0,
data: ['营业收入(亿元)', '净利润(亿元)', '权益净利润率(百分比)']
}
],
xAxis: [
{
type: 'category',
data: xData,
axisPointer: {
type: 'shadow'
},
axisTick: {
show: false
},
axisLine: {
show: true,
lineStyle: {
color: '#93ECFE',
opacity: 0.5
}
},
axisLabel: {
color: '#fff'
},
axisLabel: {
interval: 0,
rotate: 0,
formatter(value, index) {
return `{table|${
value.substring(0, 4) + '\n' + value.substring(4, value.length)
}}\n{table|${data1[index]}亿元}\n{table|${data2[index]}亿元}\n{table|${
data3[index]
}%}`;
},
rich: {
table: {
lineHeight: 35,
align: 'center',
color: '#fff'
}
}
}
}
],
yAxis: [
{
type: 'value',
name: '营业/利润',
interval: 50,
nameTextStyle: {
color: '#fff'
},
axisLabel: {
color: '#fff',
formatter: '{value} 亿元'
},
splitLine: {
show: true,
lineStyle: {
color: '#93ECFE',
opacity: 0.3
}
}
},
{
type: 'value',
name: '利润率',
min: 0,
interval: 5,
nameTextStyle: {
color: '#fff'
},
axisLabel: {
color: '#fff',
formatter: '{value} %'
},
splitLine: {
show: true,
lineStyle: {
color: '#93ECFE',
opacity: 0.3
}
}
}
],
series: [
{
name: '营业收入(亿元)',
type: 'bar',
tooltip: {
valueFormatter: function (value) {
return value + ' 亿元';
}
},
data: data1,
barWidth:20,
itemStyle: {
normal: {
barBorderRadius: [10, 10, 10, 10],
color:function(params){
return new echarts.graphic.LinearGradient(0, 0, 0, 1, [{
offset: 0, color: '#1E90FF'
}, {
offset: 1, color: 'rgba(30, 144, 255,.5)'
}]
)
}
}
},
},
{
name: '净利润(亿元)',
type: 'bar',
tooltip: {
valueFormatter: function (value) {
return value + ' 亿元';
}
},
data: data2,
barWidth:20,
itemStyle: {
normal: {
barBorderRadius: [10, 10, 10, 10],
color:function(params){
return new echarts.graphic.LinearGradient(0, 0, 0, 1, [{
offset: 0, color: '#FF0000'
}, {
offset: 1, color: 'rgba(255,0,0,.5)'
}]
)
}
}
},
},
{
name: '权益净利润率(百分比)',
type: 'line',
yAxisIndex: 1,
smooth: true,
tooltip: {
valueFormatter: function (value) {
return value + ' %';
}
},
data: data3,
}
]
};
this.chart1.setOption(option)
},
}
