一维纯对流方程代码
小乌龟学河流数值模拟
- 一维纯对流方程的求解过程
-
- 问题描述
- 解析解
- 数值解
-
- 迎风格式求解
- 特征线法求解
- 算例工况与计算结果
- 敏感性分析
-
- 浓度分布均匀性的影响(不算敏感性,单纯考虑对数值求解精度的影响)
- 库朗数影响
- 实践中的认知与遇到的错误
-
- 迎风格式的理解
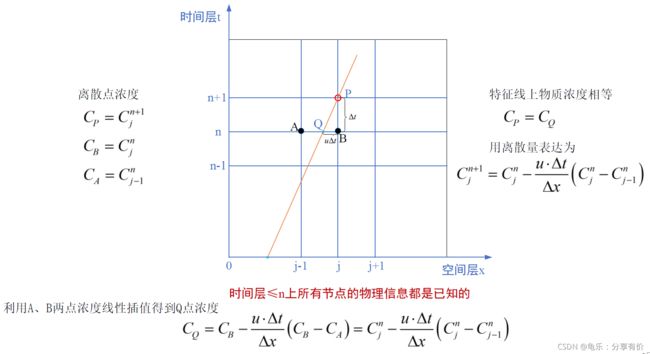
- 特征线法离散过程分析
- Δ x \Delta{x} Δx与 d x dx dx的错误理解导致对特征线法的认知错误
-
- 错误认知内容
- 错误认知产生的原因
- 错误认知产生的结果图片与MATLAB代码
- Python代码1(失败)
-
- 遇到报错信息1:TypeError with ufunc bitwise_xor
- 遇到的报错信息2:TypeError: only length-1 arrays can be converted to Python scalars
- Python代码2
- Python代码3
-
- 遇到的问题一:波形错位
- Python代码4
- MATLAB代码(成功)
-
- Matlab报错信息1:矩阵求幂的维度不正确
一维纯对流方程的求解过程
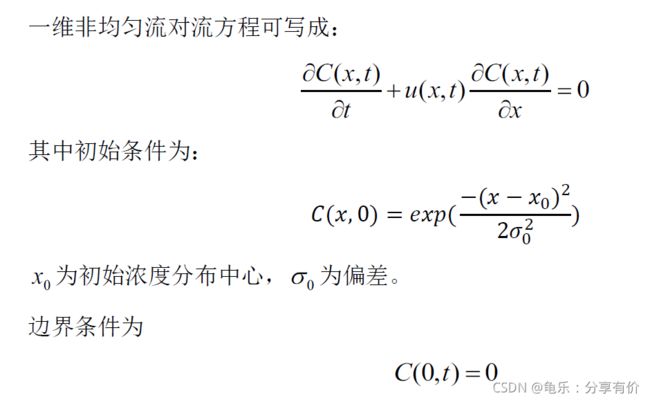
问题描述
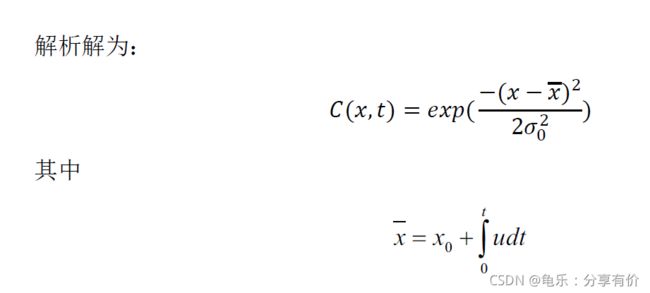
解析解
数值解
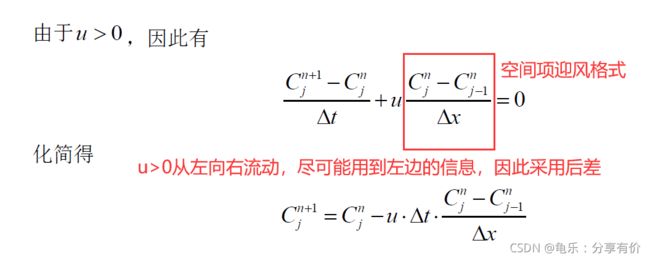
迎风格式求解
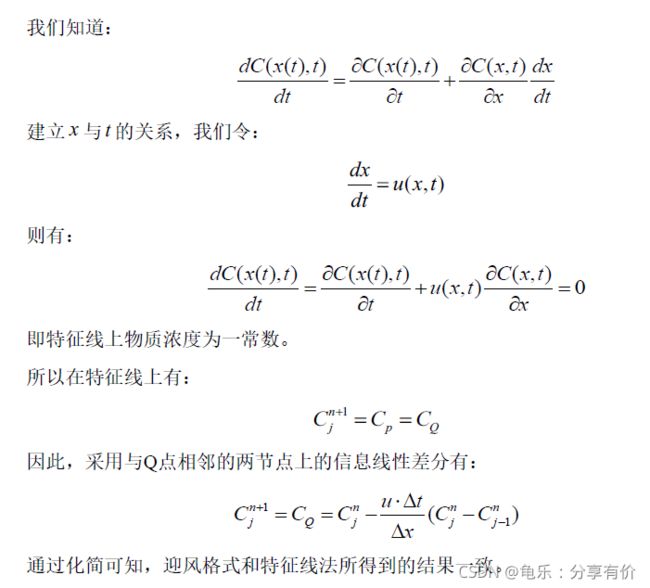
特征线法求解
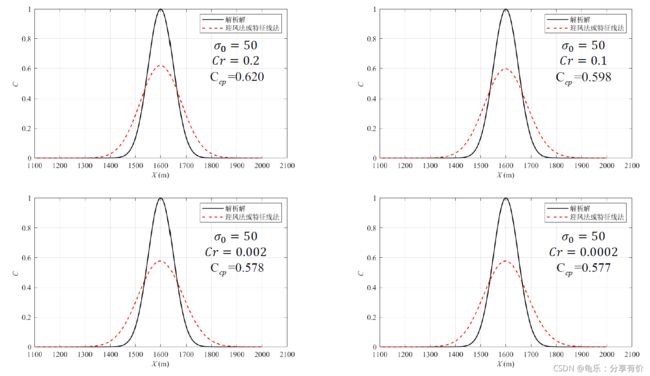
算例工况与计算结果
% Matlab代码
% This is a  First Order Upwind for Advection Equation
clear
clc

% Set the parameters
xmin = 0;
xmax = 2000;
N = 400;
dx = (xmax-xmin)/N;
tmin = 0;
tmax = 1000;
dt = 3;
u = 1;
sigma = 100;
x0 = 600;

% Set the initial condition
x = linspace(xmin, xmax+dx, N+1);
C0 = exp( -(x-x0).^2/sigma^2*0.5);
C0(1) = 0; %MATLAB Array index start from 1

Cplus = C0;
nstep = tmax/dt;


for n = 1:nstep

    Ctemp  = Cplus;
    % calculate the new value
    for i = 2:N+1
        Cplus(i) = Ctemp(i) - u*dt*(Ctemp(i) - Ctemp(i-1))/dx;
    end

end

 % calculate exact solution
Cexact = exp( -(x-x0-u*tmax).^2/sigma^2*0.5);

% visualization
figure(1)
L = plot(x,Cexact,'k-',x,Cplus,'r-','linewidth',1.2);
legend(L,'解析解','\sigma0=110','location','NorthEast','FontName','宋体');
xlabel('\itX \rm(m)');
ylabel('\itC \rm');
axis([1100 2100 0 1]);
set(gca,'FontName','Times New Roman','Fontsize',10.5);
set(get(gca,'xlabel'),'FontName','Times New Roman','Fontsize',10.5);
set(get(gca,'ylabel'),'FontName','Times New Roman','Fontsize',10.5);
grid on;
set(gcf,'PaperUnits','centimeter','PaperPosition',[0 0 16 9]);
敏感性分析
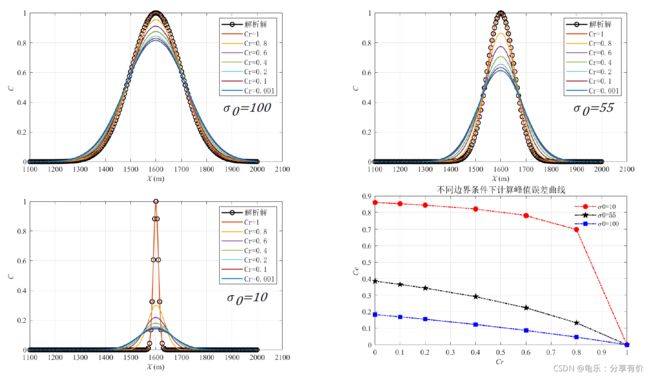
浓度分布均匀性的影响(不算敏感性,单纯考虑对数值求解精度的影响)
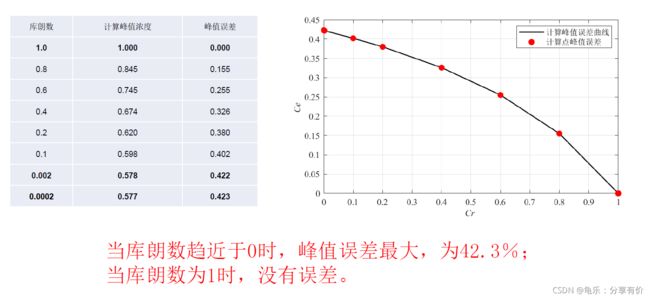
库朗数影响
实践中的认知与遇到的错误
迎风格式的理解
文章链接
对流项具有方向性,在对流项主导的运动里,某个点受到上游的影响远大于下游。迎风格式就是逆着对流的方向进行差分,以利用到更多的上游信息。假设从左到右是正方向:那么如果对流从左到右,迎风格式就是构建后差;如果对流从右到左,就是构建前差。正因为风就是一种强对流的运动,迎风格式就是逆着风吹来的方向构建差分格式,这个名字取得很形象。
作者:yms11yms
链接:https://www.zhihu.com/question/463324087/answer/1925052835
来源:知乎
著作权归作者所有。商业转载请联系作者获得授权,非商业转载请注明出处。
特征线法离散过程分析
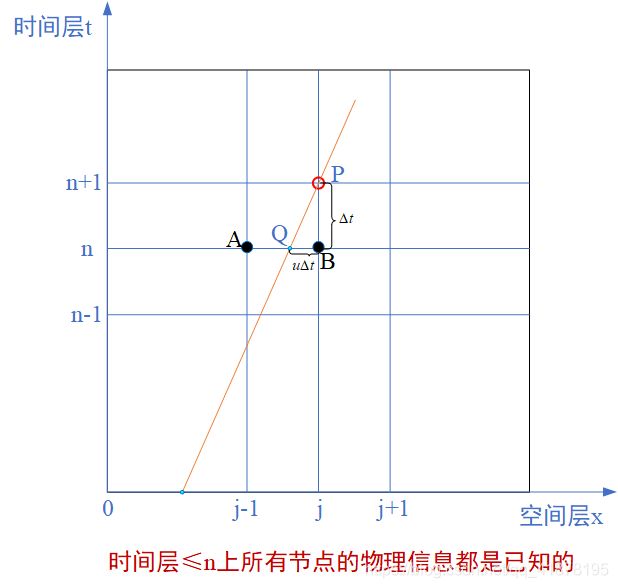
方程中所有的物理变量:本一维纯对流方程中物理变量有三个,即物质浓度 C C C,时间 t t t,空间 x x x。
全知物理量信息: A : ( x = x j − 1 , t = t n , C = C j − 1 n ) A:(x=x_{j-1},t=t_n,C=C_{j-1}^{n}) A:(x=xj−1,t=tn,C=Cj−1n) B : ( x = x j , t = t n , C = C j n ) B:(x=x_{j},t=t_n,C=C_{j}^{n}) B:(x=xj,t=tn,C=Cjn)
半知物理量信息(红色表示未知,黑色表示已知):


Q点的物质浓度C和空间位置x都是未知的。但是,我们知道时空特征线关系式,我们还知道与Q处于同一时间层的两相邻节点A、B的所有信息。因此:
利用特征线关系可以求得Q点相对于A或B的空间位置;
然后对A、B两点采用线性插值得到Q点的物质浓度;
根据特征线上任意一点的物质浓度相等可得到待求量P点的物质浓度。
Δ x \Delta{x} Δx与 d x dx dx的错误理解导致对特征线法的认知错误
本案例采用特征线法和迎风法分别离散上述一维纯对流方程,得到的离散方程都相同,即:
C j n + 1 = C j n − u Δ t Δ x ( C j n − C j − 1 n ) C_{j}^{n+1}=C_{j}^{n}-\frac{u\Delta{t}}{\Delta{x}}(C_{j}^{n}-C_{j-1}^{n}) Cjn+1=Cjn−ΔxuΔt(Cjn−Cj−1n)
错误认知内容
以下内容是2021年5月7日的错误认识:
最初,由于两者的离散方程相同,所以我错误地认为特征线法与迎风法求得的数值解是相同的。特征线法的前提条件是认为 d x d t = u \frac{dx}{dt}=u dtdx=u,所以特征线法的离散方程一定要满足这个条件,即时间和空间的离散是受到限制的。所以,本例一维纯对流方程采用特征线时离散的方程应该为:
C j n + 1 = C j − 1 n C_{j}^{n+1}=C_{j-1}^{n} Cjn+1=Cj−1n 也就是迎风法离散方程后库朗数取1时的离散方程:
C r = u Δ t Δ x = 1 Cr=\frac{u\Delta{t}}{\Delta{x}}=1 Cr=ΔxuΔt=1
错误认知产生的原因
错误地认为 Δ x \Delta{x} Δx与 d x dx dx是相等的,即认为两者表示的含义相同。实际上,两者有着本质区别: Δ x = x j − x j − 1 \Delta{x}=x_{j}-x_{j-1} Δx=xj−xj−1是两个空间点之间的距离, Δ x \Delta{x} Δx的取值可以很大,也可以趋近于0。当 Δ x \Delta{x} Δx趋近于0时与 d x dx dx等价。而 d x dx dx表示 x x x的微小增量,微小可以理解为趋近于0。所以,在空间步长 Δ x \Delta{x} Δx取值的任意性下, d x d t = u \frac{dx}{dt}=u dtdx=u不能推理出 Δ x Δ t = u \frac{\Delta{x}}{\Delta{t}}=u ΔtΔx=u。对于本案例采用特征线法的离散过程,我们可以这样理解: Δ t \Delta{t} Δt是一个微小量(即使其取值较大,我们依旧可以假定其为相对微小量),则 Δ t = d t \Delta{t}=dt Δt=dt,所以 d x = u Δ t dx=u\Delta{t} dx=uΔt( d x ≤ Δ x dx≤\Delta{x} dx≤Δx),所以 C j n + 1 有 很 大 的 可 能 性 与 C j − 1 n C_{j}^{n+1}有很大的可能性与C_{j-1}^{n} Cjn+1有很大的可能性与Cj−1n不相等。
错误认知产生的结果图片与MATLAB代码
% 再谈特征线法与迎风法
clear
clc

% Set the parameters
xmin = 0;
xmax = 2000;
N = 400;
dx = (xmax-xmin)/N;
tmin = 0;
tmax = 1000;
dt = 3;%换算成迎风时应该为5,迎风法总的时间步长将用5来换算
u = 1;
sigma = 50;
x0 = 600;
nstep = tmax/dt;

% Set the initial condition
x = linspace(xmin, xmax, N+1);
C0 = exp( -(x-x0).^2/sigma^2*0.5);
C0(1) = 0; %MATLAB Array index start from 1

Ctz = C0;%给特征线法的变量赋初值
Cyf = C0;%给迎风法的变量赋初值

% 特征线法求解
for n = 1:200 %nstep按dt=5换算过来的

    Ctemp  = Ctz;
    % calculate the new value
    for i = 2:N+1
        Ctz(i) = Ctemp(i-1);
    end

end


 % calculate exact solution
Cexact = exp( -(x-x0-u*tmax).^2/sigma^2*0.5);

% 迎风法求解
for n = 1:nstep

    Ctemp  = Cyf;
    % calculate the new value
    for i = 2:N+1
        Cyf(i) = Ctemp(i) - u*dt*(Ctemp(i) - Ctemp(i-1))/dx;

    end

end

% visualization
L = plot(x,Cexact,'k-',x,Ctz,'r--',x,Cyf,'b-','linewidth',1.2);
legend(L,'解析解','特征线法','迎风法','location','NorthEast','FontName','宋体');
xlabel('\itX \rm(m)');
ylabel('\itC \rm');
axis([1100 2100 0 1]);
set(gca,'FontName','Times New Roman','Fontsize',10.5);
set(get(gca,'xlabel'),'FontName','Times New Roman','Fontsize',10.5);
set(get(gca,'ylabel'),'FontName','Times New Roman','Fontsize',10.5);
grid on;
set(gcf,'PaperUnits','centimeter','PaperPosition',[0 0 16 9]);
离散表达式后续补充……
Python代码1(失败)
import numpy as np
import math
import matplotlib.pyplot as plt

def LinearConv(nx):
	x = np.linspace(0,6,nx)
	Lx = 6 #x为x方向的总长度
	dx = Lx/(nx-1) #dx为空间网格步长,nx为节点数
	nt = 20 #总的时间步长
	Courant = 0.8 #Courant数
	u = 1 #假设对流为常数
	dt = Courant*dx/u #时间步长

	#未知参数设定
	x_0 = 3 #初始浓度分布中心
	sigma_0 = 1 #偏差


	#初始条件和边界条件
	C[0:len(nx)] = math.exp(-(x - x_0)**2/(sigma_0)**2*0.5) #初始条件C(x,0)的表达式
	C[0] = 0
	#将初始图像画出来
	plt.plot(x,C,'r',linewidth=3,label='init')

	#计算20个时间步后的图像
	Cn = math.exp((x - x_0)^2/(sigma_0)^2*(-0.5))
	for n in range(nt):
		Cn = C.copy() #后面的计算会改变C,所以将C拷贝到Cn
		for i in range(1,nx):
			C[i] = Cn[i] - u * dt / dx *(Cn[i] - Cn[i-1])

	plt.plot(x,u,'b',linewidth = 3,label = 'current')
	plt.xlabel('distance')
	plt.ylabel('concentration')
	plt.legend()
	plt.show()

LinearConv(601)
遇到报错信息1:TypeError with ufunc bitwise_xor
具体报错信息:TypeError: ufunc ‘bitwise_xor’ not supported for the input types,and the inputs could not be safely coerced to any supported types according to the casting rule ‘‘safe’’ .
解决办法:Python中平方的表示不能用【∧ 2 2 2】,正确的语法是【 ∗ ∗ 2 **2 ∗∗2】。
TypeError with ufunc bitwise_xor解决办法来源
遇到的报错信息2:TypeError: only length-1 arrays can be converted to Python scalars
暂未找到解决办法
Python代码2
遇到的报错信息2暂时无法解决,通过联想到XY曲线绘制时的一一对应关系,退而求其次初步成功。
Python绘制指数函数(解决办法来源)
import numpy as np
import math
import matplotlib.pyplot as plt


X = np.linspace(0,6,61)
x_0 = 3
sigma_0 = 1
dx = 0.1
nt = 20
u = 0.5
dt = 0.08

def phi_func(x):
    phi = math.exp(-(x - x_0)**2/(sigma_0)**2*0.5)
    return phi

Phi = [phi_func(x) for x in X] #因为解决不了数组元素一一对应的问题,才出此下策
C = Phi
C[0] = 0
plt.plot(X,Phi,'r',linewidth=3,label='init')

Cn = Phi
for n in range(nt):
    Cn = C #list没有copy
    for i in range(1,61):
        C[i] = Cn[i]-u*dt/dx*(Cn[i]-Cn[i-1])

plt.plot(X,C,'b',linewidth=3,label='current')
plt.xlabel('distance')
plt.ylabel('concetration')
plt.legend()
plt.show()
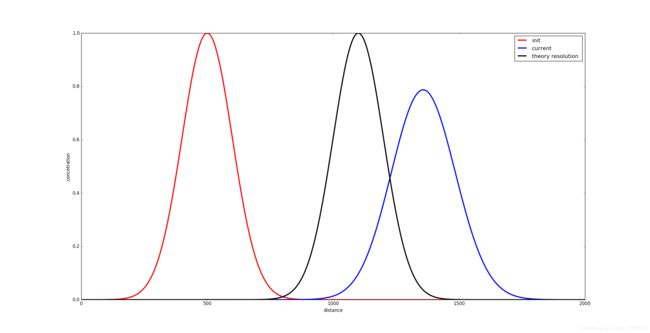
效果图如下:
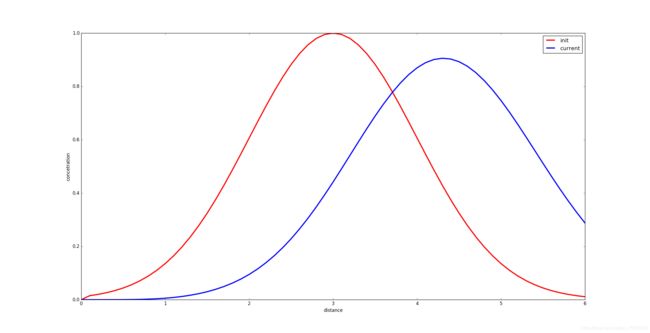
起初对解析曲线的绘制存在误解,理解成对空间和时间都要离散。突然才发现,数值计算得到的就是给定时间的最后结果,因此解析解也仅需要最后时刻即可,即时间在解析函数中是一个固定值。不过,把解析函数随时间变化的动态图做出来也是值得考虑的。
Python绘制函数曲线(绘制解析解时的解决办法来源)
Python代码3
import numpy as np
import math
import matplotlib.pyplot as plt
X = np.linspace(0,2000,401)
x_0 = 500
sigma_0 = 100
dx = 5
nt = 401#总的时间步长
u = 0.3
dt = 5

def phi_func(x):
    phi = math.exp(-(x - x_0)**2/(sigma_0)**2*0.5)
    return phi

Phi = [phi_func(x) for x in X] #因为解决不了数组元素一一对应的问题,才出此下策
C = Phi
C[0] = 0
plt.plot(X,C,'r',linewidth=3,label='init')

#Cn = Phi
for n in range(nt):
    Cn = C #list没有copy属性,所以直接整个赋值即可
    for i in range(1,401):
        C[i] = Cn[i]-u*dt/dx*(Cn[i]-Cn[i-1])

plt.plot(X,C,'b',linewidth=3,label='current')
#怎么对受x和t影响的C进行显示呢?
C = []
for x in X:
    Cn = math.exp(-(x - x_0-u*(nt-1)*dt)**2/(sigma_0)**2*0.5)
    C.append(Cn)

plt.plot(X,C,'k',linewidth=3,label='theory resolution ')

plt.xlabel('distance')
plt.ylabel('concetration')
#plt.xlim(0, 2000)

plt.legend()
plt.show()
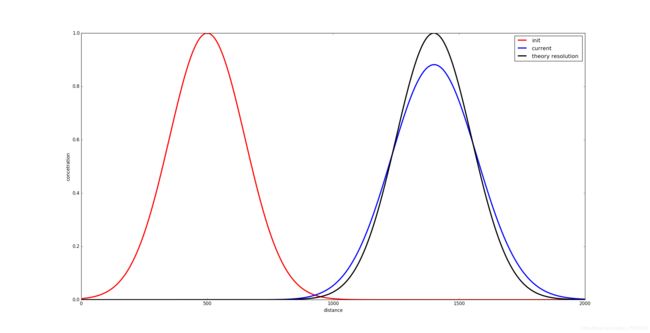
遇到的问题一:波形错位
Python代码4
为什么迭代步与预计的时间步有一定关系偏差才能得到原本正确的解,此处的关系偏差已经不能从物理意义上去理解。
Python中
import numpy as np
import math
import matplotlib.pyplot as plt


X = np.linspace(0,2000,401)
x_0 = 500
sigma_0 = 150
dx = 5
nt = 601#总的时间步长
u = 0.3
dt = 5

def phi_func(x):
    phi = math.exp(-(x - x_0)**2/(sigma_0)**2*0.5)
    return phi

Phi = [phi_func(x) for x in X] #因为解决不了数组元素一一对应的问题,才出此下策
C = Phi
C[0] = 0
plt.plot(X,C,'r',linewidth=3,label='init')

#Cn = Phi
steps = int(nt-(nt-1)*u)#range()函数内部只能是整型,u是float所以导致整个表达式为float,因此强制转换类型
for n in range(steps):#为什么迭代步为nt-(nt-1)*u才对,如nt=201,则迭代步为141

    Cn = C #list没有copy属性,所以直接整个赋值即可

    for i in range(1,401):
        C[i] = Cn[i]-u*dt/dx*(Cn[i]-Cn[i-1])

plt.plot(X,C,'b',linewidth=3,label='current')
#怎么对受x和t影响的C进行显示呢?
C = []
for x in X:
    Cn = math.exp(-(x - x_0-u*(nt-1)*dt)**2/(sigma_0)**2*0.5)
    C.append(Cn)

plt.plot(X,C,'k',linewidth=3,label='theory resolution ')

plt.xlabel('distance')
plt.ylabel('concetration')
#plt.xlim(0, 2000)

plt.legend()
plt.show() #显示出图像
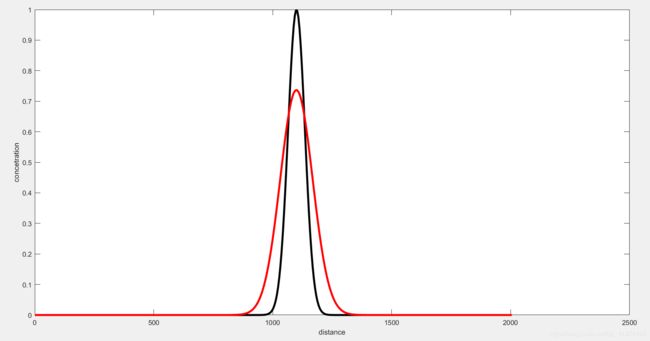
MATLAB代码(成功)
MATLAB帮助来源
% This is a demo of First Order Upwind for Advection Equation
clear
clc

% Set the parameters
xmin       = 0;
xmax       = 2000;
N          = 400;
dx         = (xmax-xmin)/N;
tmin       = 0;
tmax       = 2000;
dt         = 5;
u          = 0.3;
sigma = 50;
x0 = 500;

% Set the initial condition
x          = linspace(xmin, xmax+dx, N+1);
C0         = exp( -(x-x0).^2/sigma^2*0.5);
C0(1) = 0; %MATLAB Array index start from 1
%utemp      = u0;
Cplus      = C0;
nstep      = tmax/dt;
t          = 0;

for n      = 1:nstep

    Ctemp  = Cplus;
    % calculate the new value
    for i        = 2:N+1
        Cplus(i) = Ctemp(i) - u*dt*(Ctemp(i) - Ctemp(i-1))/dx;
    end

end

 % calculate exact solution
Cexact  = exp( -(x-x0-u*tmax).^2/sigma^2);

% visualization
plot(x,Cexact,'k-','linewidth',3)
hold on
plot(x,Ctemp,'r-','linewidth',3);
xlabel('distance');
ylabel('concetration');
hold off
% This is a  First Order Upwind for Advection Equation
clear
clc

% Set the parameters
xmin = 0;
xmax = 2000;
N = 400;
dx = (xmax-xmin)/N;
tmin = 0;
tmax = 1000;
dt = 3;
u = 1;
sigma = 110;
x0 = 600;

% Set the initial condition
x = linspace(xmin, xmax+dx, N+1);
C0 = exp( -(x-x0).^2/sigma^2*0.5);
C0(1) = 0; %MATLAB Array index start from 1

Cplus = C0;
nstep = tmax/dt;


for n = 1:nstep

    Ctemp  = Cplus;
    % calculate the new value
    for i = 2:N+1
        Cplus(i) = Ctemp(i) - u*dt*(Ctemp(i) - Ctemp(i-1))/dx;
    end

end

 % calculate exact solution
Cexact = exp( -(x-x0-u*tmax).^2/sigma^2*0.5);

% visualization
figure(1)
L = plot(x,Cexact,'k-',x,Cplus,'r-','linewidth',1.2);
legend(L,'解析解','\sigma0=110','location','NorthEast','FontName','宋体');
xlabel('\itX \rm(m)');
ylabel('\itC \rm');
axis([1100 2100 0 1]);
set(gca,'FontName','Times New Roman','Fontsize',10.5);
set(get(gca,'xlabel'),'FontName','Times New Roman','Fontsize',10.5);
set(get(gca,'ylabel'),'FontName','Times New Roman','Fontsize',10.5);
grid on;
set(gcf,'PaperUnits','centimeter','PaperPosition',[0 0 16 9]);
为什么想到用Matlab?是因为我用Python绘制时不知道如何绘制解析解的图像,真是个青菜啊。
Matlab报错信息1:矩阵求幂的维度不正确
解决办法:请检查并确保矩阵为方阵并且幂为标量。要执行按元素矩阵求幂,请使用 【.^】。比较搞笑的是,系统都提示我了,我竟然还花了一定时间才找到问题所在。
一维常系数对流方程(Python编写思路主要来源)
