Add Crash Reporting to Your Applications with the CrashRpt Library
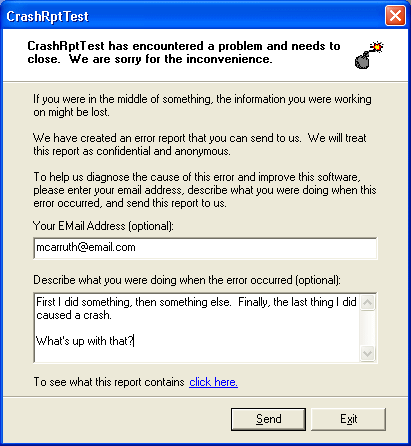
Figure 1 - Main Dialog
Contents
- Overview
- Usage
- Using the CrashRpt Library in Your Application
- Using the Crash Report
- Deployment
- References and Related Links
- Change History
Overview
If you've ever been tasked with debugging a fatal exception, you probably know how difficult it can be given only the user's steps to reproduce. Many factors such as the application's version, user's operating system, and dependent modules may contribute to the eventual crash. This makes duplicating the user's environment and thereby the crash, nearly impossible for all but the most obvious bugs.
The CrashRpt library is a light weight error handling framework. This module will intercept any unhandled exception generated by your application, build a complete debug report, and optionally, mail the report to you.
Usage
In this article, a crash report refers to a collection of files intended to help the developer quickly diagnose the cause of a crash. Specifically the crash report includes a minidump, a crash log and up to ten additional application specific files supplied by the application via a crash callback. Of these the most useful will most likely be the application minidump. The minidump contains the call stack, local variables, details all of your application's modules, and can even help pinpoint the source line number that generated the exception.
The CrashRpt DLL works like the new Dr. Watson utility that ships with XP. It intercepts unhandled exceptions, creates a minidump, builds a crash log, presents an interface to allow the user to review the crash report, and finally it compresses and optionally emails the crash report back to you.
When an unhandled exception is detected, CrashRpt notifies the user and allows them to review the report contents. First the main dialog shown above is displayed. From here the user can enter their comments and email address or review the report contents by clicking the hyperlink. This takes them to the details dialog, where they are presented with the files that make up the report. Double clicking on the filename will open that file in its associated program, if an association exists for that file type.
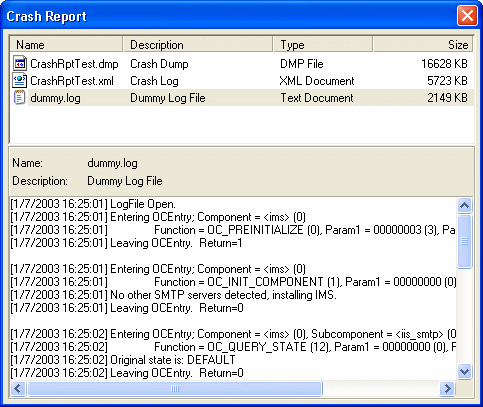
Figure 2 - Crash Details Dialog
Once the user is satisfied, he may close the details dialog and click the 'Send' button on the main dialog, which will email his complete crash report to you.
Using the CrashRpt library in Your Application
Building the library
Download and unzip the source code attached to this article. Open the complete.dsw workspace located in the top level directory. This workspace contains the source for the two sample applications and the CrashRpt library. You only need to build the CrashRpt project - crashrpt.dsp.
Notes:
- CrashRpt library uses the WTL for its GUI components, so WTL must be installed and properly configured in order to build the CrashRpt library. You can download the WTL here. If you're new to the WTL then CodeProject has some article here, and there is a good starting guide here.
- CrashRpt library uses Microsoft's Debug Help library (dbghelp.dll). The proper h and lib files must be installed and properly configured in order to build the CrashRpt library. These files are available in the Debugging SDK, which can be downloaded here (be sure to select the SDK setup option).
After the build completes, you should end up with the following:
crashrpt\include

crashrpt.h

crashrpt\bin\debug or crashrpt\bin\release

crashrpt.dll

crashrpt\lib

crashrpt.lib

crashrpt\src

[all source files...]
Linking against the library
To implicitly link against the library, you need to include the crashrpt.h file and link in the crashrpt.lib file. I find it easiest to add the following two lines to my main application file.
#include "[whateveryourpath]/crashrpt/include/crashrpt.h"

#pragma comment(lib, "[whateveryourpath]/crashrpt/lib/crashrpt")
Figure 3 - Integrating CrashRpt with your application
Initializing the library
The library needs to be initialized before it will catch any exceptions. You do this by calling the Install method, usually from your main function. The Install method is detailed below.
//-----------------------------------------------------------------------------

// Install

//    Initializes the library and optionally set the client crash callback and

//    set up the email details.

//

// Parameters

//    pfn         Client crash callback

//    lpTo        Email address to send crash report

//    lpSubject   Subject line to be used with email

//

// Return Values

//    If the function succeeds, the return value is a pointer to the underlying

//    crash object created.  This state information is required as the first

//    parameter to all other crash report functions.

//

// Remarks

//    Passing NULL for lpTo will disable the email feature and cause the crash

//    report to be saved to disk.

//

CRASHRPTAPI

LPVOID

Install(

IN LPGETLOGFILE pfn OPTIONAL,                // client crash callback

   IN LPCTSTR lpTo OPTIONAL,                    // Email:to

   IN LPCTSTR lpSubject OPTIONAL                // Email:subject

   );
Figure 4 - The Install() function
All of the parameters are optional. The first parameter is a pointer to a crash callback function defined as:
// Client crash callback

typedef BOOL (CALLBACK *LPGETLOGFILE) (LPVOID lpvState);
Figure 5 - Client crash callback
You would define this callback only if you wanted to be notified of an application failure, so that you could perform some basic clean up (i.e. close db connections, attempt to save, etc). Otherwise, you can simply pass NULL for this parameter.
The second parameter defines the email address you want the crash report mailed to, or NULL if you prefer the reports be saved to the user's workstation.
The third parameter is the subject line used in the generated mail message.
The Install function returns a pointer to the underlying object that implements the real functionality of this library. This value is required for all subsequent calls into the library.
If, after you have called Install, you decide to unhook the CrashRpt library, you would call Uninstall.
//-----------------------------------------------------------------------------

// Uninstall

//    Uninstalls the unhandled exception filter set up in Install().

//

// Parameters

//    lpState     State information returned from Install()

//

// Return Values

//    void

//

// Remarks

//    This call is optional.  The crash report library will automatically

//    deinitialize when the library is unloaded.  Call this function to

//    unhook the exception filter manually.

//

CRASHRPTAPI

void

Uninstall(

IN LPVOID lpState                            // State from Install()

   );
Figure 6 - The Uninstall function
You would only ever call Uninstall if you decided, after calling Install, that you did not want the CrashRpt library to intercept exceptions. So, basically you will probably never call this method directly.
Adding custom files to the report
The client application can, at any time, supply files to be included in the crash report by calling the AddFile function.
//-----------------------------------------------------------------------------

// AddFile

//    Adds a file to the crash report.

//

// Parameters

//    lpState     State information returned from Install()

//    lpFile      Fully qualified file name

//    lpDesc      Description of file, used by details dialog

//

// Return Values

//    void

//

// Remarks

//    This function can be called anytime after Install() to add one or more

//    files to the generated crash report.

//

CRASHRPTAPI

void

AddFile(

IN LPVOID lpState,                           // State from Install()

   IN LPCTSTR lpFile,                           // File name

   IN LPCTSTR lpDesc                            // File desc

   );
Figure 7 - The AddFile function
This is useful when your application uses or produces external files such as initialization files or log files. When a report is generated, it will include these additional files.
Manually generating a report
You can force report generation by calling the GenerateErrorReport. This is useful if you want to provide an easy way to gather debugging information about your application to help debug a non-fatal bug.
//-----------------------------------------------------------------------------

// GenerateErrorReport

//    Generates the crash report.

//

// Parameters

//    lpState     State information returned from Install()

//    pExInfo     Pointer to an EXCEPTION_POINTERS structure

//

// Return Values

//    void

//

// Remarks

//    Call this function to manually generate a crash report.

//

CRASHRPTAPI

void

GenerateErrorReport(

IN LPVOID lpState,

IN PEXCEPTION_POINTERS pExInfo OPTIONAL

);
Figure 8 - The GenerateErrorReport function
If you do not supply a valid EXCEPTION_POINTERS, structure the minidump callstack may be incomplete.
Generate debug symbols
To get the most out of the minidump, the debugger needs your application's debug symbols. By default release builds don't generate debug symbols. You can configure VC to generate debug symbols for release builds by changing a couple of project settings.
With the release build configuration selected, on the C/C++ tab under the General category, select 'Program Database' under Debug info.
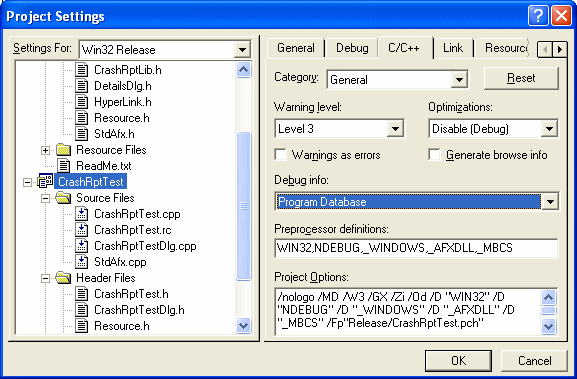
Figure 9 - C++ Project Settings
On the Link tab under the General category, check the 'Generate debug info' option.
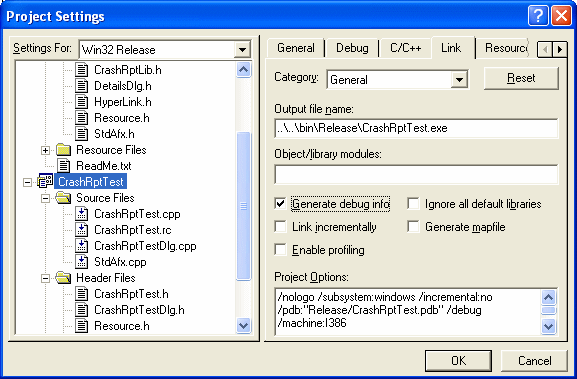
Figure 9 - Link Project Settings
Now release builds will generate debug symbols in a PDB file. Keep all executables and PDB files for each release that ships to customers. You will need these files to read minidump files in the debugger.
Using the Crash Report
Using the Crash Log
The crash log is an XML file that describes details about the crash including the type of exception, the module and offset where the exception occurred, as well as some cursory operating system and hardware information. I wrote the crash log to make it easier to catalog crashes. A crash can be uniquely identified by the module, offset and exception code. This information could be inspected by a developer or an automated process, and compared against previously reported problems. If a match is found, the developer or automated process, could inform the user of the solution without having to debug the error again.
The log is divided into four different sections or nodes. The first node is ExceptionRecord we discussed earlier.

Figure 10 - ExceptionRecord Node
Next is the Processor node, which contains a little information about the user's CPU.

Figure 11 - Process Node
Next is the OperatingSystem node, which contains the user's operating system version information.

Figure 12 - OperatingSystem Node
Last is the Modules node. This node contains the path, version, base address, size, and time stamp for every module loaded by the deceased application.

Figure 13 - Modules Node
Using the Crash Dump File
The crash dump file is a minidump created with the help of the DbgHelp DLL's MiniDumpWriteDump function. The minidump contains various information about the state of the application when the error occurred including the call stack, local variables, and loaded modules. For more on creating minidumps, check out Andy Pennell's article.
You can view minidump files in VS.NET or the WinDbg debugger. Because WinDbg is free, I'll use it in the following example. You can download WinDbg from here. I'm using version 6.1.0017.0 in the example.
The sample application included with this article does nothing but generate a null pointer exception. I'll use the sample to generate a crash and demonstrate how to use the resulting minidump.
When you run the sample application, click on the bomb button to generate a null pointer exception, and save the resulting crash report. Then extract the crash.dmp file from the crash report, launch WinDbg, and open the crash dump by pressing CTRL+D.
Next, you need to set the symbol path for WinDbg with the .sympath command. Switch to the command window (ALT+1) and enter .sympath followed by a space followed by the semi-colon delimited list of directories to search.
.sympath c:\downloads\CrashRptTest
Figure 14 - Setting the symbol path
Similarly you need to set the executable and source search paths with the .exepath and .srcpath commands.
.exepath c:\downloads\CrashRptTest

.srcpath c:\downloads\CrashRptTest
Figure 15 - Setting the source and executable paths
The final step is to change the debugger context to the context record associated with the exception by entering the .ecxr command.
.ecxr
Figure 15 - Setting the exception context record
If everything is configured correctly, you should now be able to walk the call stack, see local variables, and loaded modules. You can even have WinDbg highlight the offending line of code by double clicking the CrashRptTest frame in the Call Stack window (ALT+6). Note: The exact line number may be a little off due to linker optimizations.
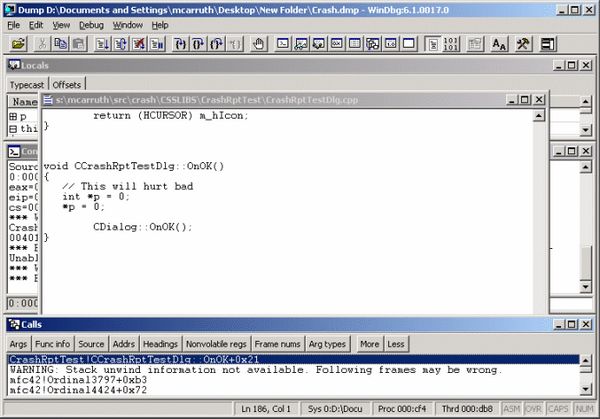
Figure 16 - The Promised Land: Using WinDbg to Locate the Cause of a Null Pointer Exception
Deployment
The CrashRpt library relies on a couple of redistributable libraries. To be sure the library has access to the required files, you can distribute the ZLib and DbgHelp I've included.
| Library | File Version | Description |
| CrashRpt.DLL | 3.0.2.1 | Crash report library |
| ZLib.DLL | 1.1.3.0 | ZLib compression library |
| DbgHlp.DLL | 6.1.17.1 | Microsoft debug help library |
Figure 17 - Redistributable Libraries
What to ship and what to save
As I mentioned earlier, to debug a crash you need not only the minidupmp file, but also the symbol and executable files that make up your application. When preparing a build to be released to clients, you should always save the exact executable modules you ship to clients, along with the corresponding debug symbols. This way when a crash report comes in, you will have the modules and debug symbols that the debugger will need to properly interpret the minidump.
I've received several comments/inquiries about shipping debug builds or debug symbols. You should never ship debug builds or debug symbols as they will not only take up more space on your CD/download/client's workstation, but they will also make reverse engineering your code a trivial exercise. To be clear, what I'm suggesting is modify your release build configuration so that it generates debug symbols, saving both the release builds of your modules and their corresponding debug symbols in your source control system and delivering only the release builds of your modules to clients (as you do today). When a crash report comes in, you use the release build and debug symbols you archived, along with the minidump included in the crash report, to debug the crash.
Note: CrashRpt uses Microsoft's Debug Help library (dbghelp.dll). This library was shipped with Windows XP, but certain versions are redistributable. I recommend you to install the dbghelp.dll file, included in the source/demo attachments, along the crashrpt.dll into your application's directory to avoid the possible conflict or missing dependency issues..
A word about preferred base load addresses
Every executable module (EXE, DLL, OCX, whatever) has a preferred base load address. This is the address in the application's process space that the loader will try to map that module. If two or more modules list the same base load address, the loader will be forced to relocate the modules until each module loads at a unique address. Not only does this slow down the start up time of your application, but it also makes it impossible to debug fatal exceptions. In order to use the minidump file, you must ensure that your application's modules do not collide. You can use rebase.exe or manually override the preferred base load address for each conflicting module. Either way you need to make sure that your application modules always load at the same address for the minidump file to be useful. You can find more information about this in John Robbin's April 1998 MSJ column.
References
For additional information about topics directly related to this article, see the links below:
- Debugging Tools for Windows.
- WTL Download.
- ZLib Compression Library.
- Reading Minidump Files with VS.NET.
- John Robbins on Crash Dumps.
- April 1998 MSJ Bugslayer Column.
- WTL Reference.
Change History
- 03/17/2003
Major Changes.
- Replaced MFC with WTL.
- Changed crashrpt interface.
- Major refactoring.
- Updated article.
Minor Changes.
- Details dialog preview window now uses system defined window color instead of white.
- Directory structure not saved in ZIP.
Bugs Fixed
- Support for use by multiple apps.
- Buffer overrun error when previewing files > 32k.
- Main dialog now displays app icon.
- 01/12/2003
- Initial release.