- 说说 Spring MVC 的执行流程?
浮生带你学Java
Java面试题Springspringmvcjava
高频面试题:说说SpringMVC的执行流程?大家好,我是浮生,一个工作了十四年的java程序员!昨天,一个工作2年的粉丝在面试的时候,面试官要求他说SpringMVC的执行流程。他没回答上来,错过了这个offer。一、问题解析SpringMVC的执行流程,一个面试频率超级高的问题,但是缺难倒了无数的程序员。这个问题的考察范围主要是3~5年,甚至5年以上都会问到。和它同类型的问题还有Bean的加载
- SpringCloud/Boot集成LogBack
azoon.top
springcloudlogbackspringlog4jslf4j
一.简要介绍什么是SLF4J?官网介绍:SimpleLoggingFacadeforJava(SLF4J)充当简单的各种日志记录框架的Facade或抽象(e.g.java.util.logging、logback、log4j)允许最终用户在部署时插入所需的日志记录框架。类似java中的接口,如果只集成SLF4J,日志只能输出在控制台,并没有输出到文件的能力,要实现真正的日志能力,需要引入其实现层:
- Pytorch使用手册--将 PyTorch 模型导出为 ONNX(专题二十六)
AI专题精讲
Pytorch入门到精通pytorch人工智能python
注意截至PyTorch2.1,ONNX导出器有两个版本。torch.onnx.dynamo_export是最新的(仍处于测试阶段)导出器,基于PyTorch2.0发布的TorchDynamo技术。torch.onnx.export基于TorchScript后端,自PyTorch1.2.0起可用。一、torch.onnx.dynamo_export使用在60分钟入门中,我们有机会从高层次上了解PyT
- spring boot、spring cloud、spring cloud alibaba 之间的版本对应关系
薄荷街的兔比先生
springbootspringcloudjava
大家在引用pom的时候还是要以官方推荐版本为主,不然容易出现未知的问题。1.springboot和springcloud的版本关系官方提供的版本对照表https://start.spring.io/actuator/info{"git":{"branch":"93e528fc7e79e41a513e493d057499401a15eb67","commit":{"id":"93e528f","ti
- SpringBoot + vue 管理系统
m0_74825565
面试学习路线阿里巴巴springbootvue.js后端
SpringBoot+vue管理系统文章目录SpringBoot+vue管理系统1、成品效果展示2、项目准备3、项目开发3.1、部门管理3.1.1、前端核心代码3.1.2、后端代码实现3.2、员工管理3.2.1、前端核心代码3.2.2、后端代码实现3.3、班级管理3.3.1、前端核心代码3.3.2、后端代码实现3.4、学生管理3.4.1、前端核心代码3.4.2、后端代码实现3.5、数据统计3.5.
- Spring 核心技术解析【纯干货版】- XII:Spring 数据访问模块 Spring-R2dbc 模块精讲
m0_74825003
面试学习路线阿里巴巴springjava后端
在现代应用架构中,高并发、低延迟的需求推动了响应式编程的发展,而传统的JDBC由于其同步阻塞机制,在高吞吐场景下可能成为瓶颈。R2DBC(ReactiveRelationalDatabaseConnectivity)作为响应式关系型数据库访问标准,正是为了解决这一问题而诞生的。SpringR2DBC作为Spring生态对R2DBC的封装,提供了非阻塞、异步的数据库访问能力,并与SpringWebF
- Spring Boot的项目结构
m0_74823983
面试学习路线阿里巴巴springboot后端java
SpringBoot的项目结构技术背景SpringBoot项目结构遵循Maven或Gradle的标准目录结构,同时融入了SpringBoot的特定约定。良好的项目结构不仅有助于代码组织,还能提高开发效率和项目可维护性。了解SpringBoot的项目结构对于开发高质量的应用至关重要。1.基础项目结构1.1标准目录结构基本的SpringBoot项目结构如下:myproject/├──src/│├──m
- Spring Cloud Alibaba Spring Cloud Spring Boot 版本对应关系
马丁半只瞄
javaspringspringbootspringcloud
版本不对应可能有以下报错:Failedtobindpropertiesundermybatis-plus.configuration.result-maps[0]NoClassDefFoundError:reactor/netty/http/server/WebsocketServerSpec$Builderreactor.netty.resources.ConnectionProvider.el
- Llama.cpp 服务器安装指南(使用 Docker,GPU 专用)
田猿笔记
AI高级应用llama服务器dockerllama.cpp
前置条件在开始之前,请确保你的系统满足以下要求:操作系统:Ubuntu20.04/22.04(或支持Docker的Linux系统)。硬件:NVIDIAGPU(例如RTX4090)。内存:16GB+系统内存,GPU需12GB+显存(RTX4090有24GB)。存储:15GB+可用空间(用于源码、镜像和模型文件)。网络:需要互联网连接以下载源码和依赖。软件:已安装并运行Docker。已安装NVIDIA
- Spring Boot@Component注解下的类无法@Autowired的问题
Micrle_007
springbootSpring
这个问题心累(确实)在把我的一个非Web程序迁移从Spring迁移到SpringBoot时,出现了在@Component注解下@Autowired的类为null的情况,也就是没注入成功,或者说是此类在bean加载之前就被调用了。试了各种办法,修改扫描包,修改@Component注解等等,皆未成功,后来看到了一个方法,探究了一下。@ComponentpublicclassComponentClass
- spring cloud alibaba版本对应表(2024/6/26)
翻身仗
springcloudspringboot中间件
毕业版本依赖关系(推荐使用)由于SpringBoot3.0,SpringBoot2.7~2.4和2.4以下版本之间变化较大,目前企业级客户老项目相关SpringBoot版本仍停留在SpringBoot2.4以下,为了同时满足存量用户和新用户不同需求,社区以SpringBoot3.0和2.4分别为分界线,同时维护2022.x、2021.x、2.2.x三个分支迭代。如果不想跨分支升级,如需使用新特性,
- 国内短剧系统源码部署小程序体验测评讲解
南阳迈特网络科技
短剧源码短剧小程序短剧系统小程序系统架构php
在移动互联网飞速发展的今天,短剧作为一种新兴的娱乐形式,凭借其短小精悍、内容丰富的特点,迅速赢得了大量用户的青睐。作为一名软件测试人员,我有幸深入体验了一款功能全面、设计精良的短剧小程序。本文将从前端设计、后端功能、用户体验以及服务支持等多个角度,对这款小程序进行详细评测。如果您也感兴趣欢迎点我了解一起探讨一下吧一、前端设计:灵活与美观的完美融合1.运营方自由DIY:个性化定制的极致体验这款小程序
- Spring Bean 的生命周期全过程
2401_85327573
springjava后端
SpringBean的生命周期是指从Bean的创建到销毁的整个过程。在这个过程中,Spring容器会按照一系列固定的步骤对Bean进行初始化、配置、使用和销毁。了解SpringBean的生命周期可以帮助我们更好地理解和使用Spring框架,尤其是通过自定义生命周期行为来实现特定功能。以下是SpringBean生命周期的全过程,按阶段详细说明:---###**1.实例化(Instantiation)
- Exception:data did not match any variant of untagged enum PyPreTokenizerTypeWrapper at line 69 解决方案
爱编程的喵喵
Python基础课程pythontokenizerPyPreTokenizer解决方案
大家好,我是爱编程的喵喵。双985硕士毕业,现担任全栈工程师一职,热衷于将数据思维应用到工作与生活中。从事机器学习以及相关的前后端开发工作。曾在阿里云、科大讯飞、CCF等比赛获得多次Top名次。现为CSDN博客专家、人工智能领域优质创作者。喜欢通过博客创作的方式对所学的知识进行总结与归纳,不仅形成深入且独到的理解,而且能够帮助新手快速入门。 本文主要介绍了Exception:datadidn
- Spring Boot @Component注解介绍
CnLg.NJ
Javaspringboot后端java
@Component是Spring中的一个核心注解,用于声明一个类为Spring管理的组件(Bean)。它是一个通用的注解,可以用于任何层次的类(如服务层、控制器层、持久层等)。通过@Component注解,Spring会自动检测并注册该类为一个Bean,从而实现依赖注入和生命周期管理。1.@Component的作用@Component是一个元注解,它本身被@Configuration、@Serv
- React低代码项目:用户登陆
CaptainDrake
react.js低代码前端
吐司问卷:用户登陆Date:February17,20254:12PM(GMT+8)JWT**概念:**登陆成功后,服务端返回一个tokenJWT组成:JWT由三个部分组成:头部(Header)、载荷(Payload)和签名(Signature)。它们通过点(.)连接,格式如下:header.payload.signature示例:假设用户登录成功,后端生成了一个JWT,格式如下:eyJhbGci
- 一个基于 React + SpringBoot 的在线多功能问卷系统(附源码)
程序员-李旭亮
Java项目源码react.jsspringboot前端
简介:一个基于React+SpringBoot的在线多功能问卷系统前端技术栈:React、React-Router、Webpack、Antd、Zustand、Echarts、DnDKit后端技术栈:SpringBoot、MySQL、MyBatisPlus、Redis项目源码下载链接:https://pan.quark.cn/s/2e32786e0c61部分页面静态预览:主要前端业务需求与技术突破:
- Java与Spring的“甜蜜毒药”:从辉煌到疲态的技术反思
步子哥
javaspringpython
“Java生态就像一场漫长的婚姻,Spring是那个看似完美的伴侣,但当你意识到对方的控制欲时,已经为TA背上了巨额房贷。”Java,这位曾经的企业级开发之王,如今却像一位中年危机的技术巨人,站在2023年的技术浪潮中,显露出疲态。而Spring,这个曾经被誉为“轻量级救世主”的框架,早已从灵活的工具箱变成了沉重的枷锁。今天,我们就来聊聊这对技术界的“黄金搭档”,如何从蜜月期走向了“分居边缘”。Ⅰ
- Spring Boot 集成 Kafka
m0_74823471
面试学习路线阿里巴巴springbootkafkalinq
在现代软件开发中,分布式系统和微服务架构越来越受到关注。为了实现系统之间的异步通信和解耦,消息队列成为了一种重要的技术手段。Kafka作为一种高性能、分布式的消息队列系统,被广泛应用于各种场景。而SpringBoot作为一种流行的Java开发框架,提供了便捷的方式来构建应用程序。本文将介绍如何在SpringBoot项目中集成Kafka,包括Kafka的基本概念、SpringBoot集成Kafka的
- server.servlet.session.timeout: 12h(HTTP 会话的超时时间为 12 小时)
小丁学Java
产品资质管理系统servlethttpfirefox
从你提供的配置文件(应该是SpringBoot的application.yml或application.properties文件)来看,以下部分与会话超时时间相关:server:servlet:session:timeout:12h#timeout:30cookie:name:VENDER_SID会话超时时间的设置server.servlet.session.timeout:12h:这行配置明确指
- 点击修改按钮图片显示有问题
小丁学Java
产品资质管理系统vue
问题可能出在表单数据的初始化上。在ave-form.vue中,我们需要处理一下从后端返回的图片数据,因为它们可能是JSON字符串格式。vue:src/views/tools/fake-strategy/components/ave-form.vue//...existingcode...@Watch('value')watchValue(v:any){this.$nextTick(()=>{thi
- Spring Boot中@Transactional 注解
Bnuzxh
Springbootspringspringboot
Previously:调用接口先打在Controller上相应方法,然后Controller中调Service再有Service的实现层Impl去实现相应业务,所以ServiceImpl会实现Service的接口一般有注解@Override但是突然发现某个方法下除了@Override居然还有个@Transactional那这个是个什么东西呢?Spring事务管理分为:编程式和声明式的两种方式一、编
- Spring Boot 动态配置数据源全解析
♢.*
springboot后端java
亲爱的小伙伴们,在求知的漫漫旅途中,若你对深度学习的奥秘、Java与Python的奇妙世界,亦或是读研论文的撰写攻略有所探寻,那不妨给我一个小小的关注吧。我会精心筹备,在未来的日子里不定期地为大家呈上这些领域的知识宝藏与实用经验分享。每一个点赞,都如同春日里的一缕阳光,给予我满满的动力与温暖,让我们在学习成长的道路上相伴而行,共同进步✨。期待你的关注与点赞哟!引言在企业级应用开发中,单一数据源往往
- 【云原生】Docker搭建知识库文档协作平台Confluence
逆风飞翔的小叔
运维ConfluenceConfluence搭建Confluence使用Confluence搭建与使用Confluence使用详解
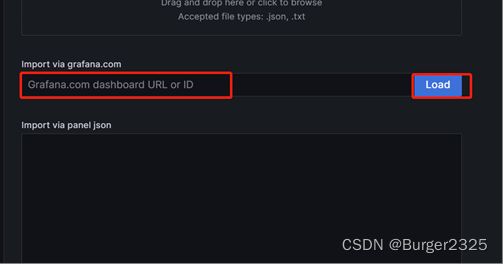
目录一、前言二、企业级知识库文档工具部署形式2.1开源工具平台2.1.1开源工具优点2.1.2开源工具缺点2.2私有化部署2.3混合部署三、如何选择合适的知识库平台工具3.1明确目标和需求3.2选择合适的知识库平台工具四、Confluence介绍4.2confluence特点4.3Confluence中的几个概念4.3.1空间(Space)4.3.2Dashboard4.3.3页面(Page)4.
- 《Spring Boot + MySQL高性能应用实战:性能优化技巧与最佳实践》
扣丁梦想家
Springspringbootmysql后端
目录应用性能优化概述环境搭建与技术栈选择数据库设计优化SpringBoot与MySQL集成优化4.1使用JPA/Hibernate的性能优化4.2连接池的配置与优化4.3分页与查询优化MySQL性能优化5.1索引优化5.2查询缓存与慢查询分析应用性能监控与日志总结与最佳实践应用性能优化概述在高性能应用的构建过程中,我们不仅需要关注数据库性能,还要从以下几个方面进行优化:数据库设计优化:合理设计表结
- Spring Boot 中 @Transactional 注解全面解析
♢.*
springboot数据库sql
亲爱的小伙伴们,在求知的漫漫旅途中,若你对深度学习的奥秘、Java与Python的奇妙世界,亦或是读研论文的撰写攻略有所探寻,那不妨给我一个小小的关注吧。我会精心筹备,在未来的日子里不定期地为大家呈上这些领域的知识宝藏与实用经验分享。每一个点赞,都如同春日里的一缕阳光,给予我满满的动力与温暖,让我们在学习成长的道路上相伴而行,共同进步✨。期待你的关注与点赞哟!引言在企业级应用开发中,数据的一致性和
- 镜像解决,向量数据库Milvus报错
zwzscnds
dockermilvus
MilvusMilvus是一款开源的向量数据库,具有高度的灵活性、稳定可靠性以及高速查询等特点。它支持针对TB级向量的增删改操作和近实时查询,适用于大规模向量数据的存储和检索。Milvus的官网:https://milvus.ioGithub上Milvus的链接:https://github.com/milvus-ioDockerDocker是一种容器化技术,它允许开发者将应用程序及其依赖项打包到
- 向量数据库milvus部署
一方有点方
milvus
官方文档MilvusvectordatabasedocumentationRunMilvusinDocker(Linux)|MilvusDocumentationMilvusvectordatabasedocumentation按部署比较简单,这里说一下遇到的问题一:DockerCompose方式部署1、镜像无法拉取,(docker.io被禁)只能获取以下镜像,image:quay.io/core
- 自学网络安全(黑客技术)2025年 —100天学习计划
白帽黑客cst
学习网络安全web安全linux
基于入门网络安全/黑客打造的:黑客&网络安全入门&进阶学习资源包前言什么是网络安全网络安全可以基于攻击和防御视角来分类,我们经常听到的“红队”、“渗透测试”等就是研究攻击技术,而“蓝队”、“安全运营”、“安全运维”则研究防御技术。如何成为一名黑客很多朋友在学习安全方面都会半路转行,因为不知如何去学,在这里,我将这个整份答案分为黑客(网络安全)入门必备、黑客(网络安全)职业指南、黑客(网络安全)学习
- 自学网络安全(黑客技术)2025年 —100天学习计划
白帽黑客cst
学习web安全安全网络linux
基于入门网络安全/黑客打造的:黑客&网络安全入门&进阶学习资源包前言什么是网络安全网络安全可以基于攻击和防御视角来分类,我们经常听到的“红队”、“渗透测试”等就是研究攻击技术,而“蓝队”、“安全运营”、“安全运维”则研究防御技术。如何成为一名黑客很多朋友在学习安全方面都会半路转行,因为不知如何去学,在这里,我将这个整份答案分为黑客(网络安全)入门必备、黑客(网络安全)职业指南、黑客(网络安全)学习
- jdk tomcat 环境变量配置
Array_06
javajdktomcat
Win7 下如何配置java环境变量
1。准备jdk包,win7系统,tomcat安装包(均上网下载即可)
2。进行对jdk的安装,尽量为默认路径(但要记住啊!!以防以后配置用。。。)
3。分别配置高级环境变量。
电脑-->右击属性-->高级环境变量-->环境变量。
分别配置 :
path
&nbs
- Spring调SDK包报java.lang.NoSuchFieldError错误
bijian1013
javaspring
在工作中调另一个系统的SDK包,出现如下java.lang.NoSuchFieldError错误。
org.springframework.web.util.NestedServletException: Handler processing failed; nested exception is java.l
- LeetCode[位运算] - #136 数组中的单一数
Cwind
java题解位运算LeetCodeAlgorithm
原题链接:#136 Single Number
要求:
给定一个整型数组,其中除了一个元素之外,每个元素都出现两次。找出这个元素
注意:算法的时间复杂度应为O(n),最好不使用额外的内存空间
难度:中等
分析:
题目限定了线性的时间复杂度,同时不使用额外的空间,即要求只遍历数组一遍得出结果。由于异或运算 n XOR n = 0, n XOR 0 = n,故将数组中的每个元素进
- qq登陆界面开发
15700786134
qq
今天我们来开发一个qq登陆界面,首先写一个界面程序,一个界面首先是一个Frame对象,即是一个窗体。然后在这个窗体上放置其他组件。代码如下:
public class First { public void initul(){ jf=ne
- Linux的程序包管理器RPM
被触发
linux
在早期我们使用源代码的方式来安装软件时,都需要先把源程序代码编译成可执行的二进制安装程序,然后进行安装。这就意味着每次安装软件都需要经过预处理-->编译-->汇编-->链接-->生成安装文件--> 安装,这个复杂而艰辛的过程。为简化安装步骤,便于广大用户的安装部署程序,程序提供商就在特定的系统上面编译好相关程序的安装文件并进行打包,提供给大家下载,我们只需要根据自己的
- socket通信遇到EOFException
肆无忌惮_
EOFException
java.io.EOFException
at java.io.ObjectInputStream$PeekInputStream.readFully(ObjectInputStream.java:2281)
at java.io.ObjectInputStream$BlockDataInputStream.readShort(ObjectInputStream.java:
- 基于spring的web项目定时操作
知了ing
javaWeb
废话不多说,直接上代码,很简单 配置一下项目启动就行
1,web.xml
<?xml version="1.0" encoding="UTF-8"?>
<web-app xmlns:xsi="http://www.w3.org/2001/XMLSchema-instance"
xmlns="h
- 树形结构的数据库表Schema设计
矮蛋蛋
schema
原文地址:
http://blog.csdn.net/MONKEY_D_MENG/article/details/6647488
程序设计过程中,我们常常用树形结构来表征某些数据的关联关系,如企业上下级部门、栏目结构、商品分类等等,通常而言,这些树状结构需要借助于数据库完成持久化。然而目前的各种基于关系的数据库,都是以二维表的形式记录存储数据信息,
- maven将jar包和源码一起打包到本地仓库
alleni123
maven
http://stackoverflow.com/questions/4031987/how-to-upload-sources-to-local-maven-repository
<project>
...
<build>
<plugins>
<plugin>
<groupI
- java IO操作 与 File 获取文件或文件夹的大小,可读,等属性!!!
百合不是茶
类 File
File是指文件和目录路径名的抽象表示形式。
1,何为文件:
标准文件(txt doc mp3...)
目录文件(文件夹)
虚拟内存文件
2,File类中有可以创建文件的 createNewFile()方法,在创建新文件的时候需要try{} catch(){}因为可能会抛出异常;也有可以判断文件是否是一个标准文件的方法isFile();这些防抖都
- Spring注入有继承关系的类(2)
bijian1013
javaspring
被注入类的父类有相应的属性,Spring可以直接注入相应的属性,如下所例:1.AClass类
package com.bijian.spring.test4;
public class AClass {
private String a;
private String b;
public String getA() {
retu
- 30岁转型期你能否成为成功人士
bijian1013
成长励志
很多人由于年轻时走了弯路,到了30岁一事无成,这样的例子大有人在。但同样也有一些人,整个职业生涯都发展得很优秀,到了30岁已经成为职场的精英阶层。由于做猎头的原因,我们接触很多30岁左右的经理人,发现他们在职业发展道路上往往有很多致命的问题。在30岁之前,他们的职业生涯表现很优秀,但从30岁到40岁这一段,很多人
- 【Velocity四】Velocity与Java互操作
bit1129
velocity
Velocity出现的目的用于简化基于MVC的web应用开发,用于替代JSP标签技术,那么Velocity如何访问Java代码.本篇继续以Velocity三http://bit1129.iteye.com/blog/2106142中的例子为基础,
POJO
package com.tom.servlets;
public
- 【Hive十一】Hive数据倾斜优化
bit1129
hive
什么是Hive数据倾斜问题
操作:join,group by,count distinct
现象:任务进度长时间维持在99%(或100%),查看任务监控页面,发现只有少量(1个或几个)reduce子任务未完成;查看未完成的子任务,可以看到本地读写数据量积累非常大,通常超过10GB可以认定为发生数据倾斜。
原因:key分布不均匀
倾斜度衡量:平均记录数超过50w且
- 在nginx中集成lua脚本:添加自定义Http头,封IP等
ronin47
nginx lua csrf
Lua是一个可以嵌入到Nginx配置文件中的动态脚本语言,从而可以在Nginx请求处理的任何阶段执行各种Lua代码。刚开始我们只是用Lua 把请求路由到后端服务器,但是它对我们架构的作用超出了我们的预期。下面就讲讲我们所做的工作。 强制搜索引擎只索引mixlr.com
Google把子域名当作完全独立的网站,我们不希望爬虫抓取子域名的页面,降低我们的Page rank。
location /{
- java-3.求子数组的最大和
bylijinnan
java
package beautyOfCoding;
public class MaxSubArraySum {
/**
* 3.求子数组的最大和
题目描述:
输入一个整形数组,数组里有正数也有负数。
数组中连续的一个或多个整数组成一个子数组,每个子数组都有一个和。
求所有子数组的和的最大值。要求时间复杂度为O(n)。
例如输入的数组为1, -2, 3, 10, -4,
- Netty源码学习-FileRegion
bylijinnan
javanetty
今天看org.jboss.netty.example.http.file.HttpStaticFileServerHandler.java
可以直接往channel里面写入一个FileRegion对象,而不需要相应的encoder:
//pipeline(没有诸如“FileRegionEncoder”的handler):
public ChannelPipeline ge
- 使用ZeroClipboard解决跨浏览器复制到剪贴板的问题
cngolon
跨浏览器复制到粘贴板Zero Clipboard
Zero Clipboard的实现原理
Zero Clipboard 利用透明的Flash让其漂浮在复制按钮之上,这样其实点击的不是按钮而是 Flash ,这样将需要的内容传入Flash,再通过Flash的复制功能把传入的内容复制到剪贴板。
Zero Clipboard的安装方法
首先需要下载 Zero Clipboard的压缩包,解压后把文件夹中两个文件:ZeroClipboard.js
- 单例模式
cuishikuan
单例模式
第一种(懒汉,线程不安全):
public class Singleton { 2 private static Singleton instance; 3 pri
- spring+websocket的使用
dalan_123
一、spring配置文件
<?xml version="1.0" encoding="UTF-8"?><beans xmlns="http://www.springframework.org/schema/beans" xmlns:xsi="http://www.w3.or
- 细节问题:ZEROFILL的用法范围。
dcj3sjt126com
mysql
1、zerofill把月份中的一位数字比如1,2,3等加前导0
mysql> CREATE TABLE t1 (year YEAR(4), month INT(2) UNSIGNED ZEROFILL, -> day
- Android开发10——Activity的跳转与传值
dcj3sjt126com
Android开发
Activity跳转与传值,主要是通过Intent类,Intent的作用是激活组件和附带数据。
一、Activity跳转
方法一Intent intent = new Intent(A.this, B.class); startActivity(intent)
方法二Intent intent = new Intent();intent.setCla
- jdbc 得到表结构、主键
eksliang
jdbc 得到表结构、主键
转自博客:http://blog.csdn.net/ocean1010/article/details/7266042
假设有个con DatabaseMetaData dbmd = con.getMetaData(); rs = dbmd.getColumns(con.getCatalog(), schema, tableName, null); rs.getSt
- Android 应用程序开关GPS
gqdy365
android
要在应用程序中操作GPS开关需要权限:
<uses-permission android:name="android.permission.WRITE_SECURE_SETTINGS" />
但在配置文件中添加此权限之后会报错,无法再eclipse里面正常编译,怎么办?
1、方法一:将项目放到Android源码中编译;
2、方法二:网上有人说cl
- Windows上调试MapReduce
zhiquanliu
mapreduce
1.下载hadoop2x-eclipse-plugin https://github.com/winghc/hadoop2x-eclipse-plugin.git 把 hadoop2.6.0-eclipse-plugin.jar 放到eclipse plugin 目录中。 2.下载 hadoop2.6_x64_.zip http://dl.iteye.com/topics/download/d2b
- 如何看待一些知名博客推广软文的行为?
justjavac
博客
本文来自我在知乎上的一个回答:http://www.zhihu.com/question/23431810/answer/24588621
互联网上的两种典型心态:
当初求种像条狗,如今撸完嫌人丑
当初搜贴像条犬,如今读完嫌人软
你为啥感觉不舒服呢?
难道非得要作者把自己的劳动成果免费给你用,你才舒服?
就如同 Google 关闭了 Gooled Reader,那是
- sql优化总结
macroli
sql
为了是自己对sql优化有更好的原则性,在这里做一下总结,个人原则如有不对请多多指教。谢谢!
要知道一个简单的sql语句执行效率,就要有查看方式,一遍更好的进行优化。
一、简单的统计语句执行时间
declare @d datetime ---定义一个datetime的变量set @d=getdate() ---获取查询语句开始前的时间select user_id
- Linux Oracle中常遇到的一些问题及命令总结
超声波
oraclelinux
1.linux更改主机名
(1)#hostname oracledb 临时修改主机名
(2) vi /etc/sysconfig/network 修改hostname
(3) vi /etc/hosts 修改IP对应的主机名
2.linux重启oracle实例及监听的各种方法
(注意操作的顺序应该是先监听,后数据库实例)
&nbs
- hive函数大全及使用示例
superlxw1234
hadoophive函数
具体说明及示例参 见附件文档。
文档目录:
目录
一、关系运算: 4
1. 等值比较: = 4
2. 不等值比较: <> 4
3. 小于比较: < 4
4. 小于等于比较: <= 4
5. 大于比较: > 5
6. 大于等于比较: >= 5
7. 空值判断: IS NULL 5
- Spring 4.2新特性-使用@Order调整配置类加载顺序
wiselyman
spring 4
4.1 @Order
Spring 4.2 利用@Order控制配置类的加载顺序
4.2 演示
两个演示bean
package com.wisely.spring4_2.order;
public class Demo1Service {
}
package com.wisely.spring4_2.order;
public class