DataFrame.plot函数详解(三)
DataFrame.plot函数详解(三)
1. bar
speed = [0.1, 17.5, 40, 48, 52, 69, 88]
lifespan = [2, 8, 70, 1.5, 25, 12, 28]
index = ['snail', 'pig', 'elephant',
         'rabbit', 'giraffe', 'coyote', 'horse']
df = pd.DataFrame({'speed': speed,
                   'lifespan': lifespan}, index=index)
df.plot.bar(rot=-30,alpha=0.5)
plt.show()
rot=-30 X轴标签向右旋转30度
alpha=0.5 透明度50%
效果如下:

speed = [0.1, 17.5, 40, 48, 52, 69, 88]
lifespan = [2, 8, 70, 1.5, 25, 12, 28]
index = ['snail', 'pig', 'elephant',
         'rabbit', 'giraffe', 'coyote', 'horse']
df = pd.DataFrame({'speed': speed,
                   'lifespan': lifespan}, index=index)
df.plot.bar(rot=-30,alpha=0.5,stacked=True)
plt.show()
stacked=True ,柱状图堆积显示

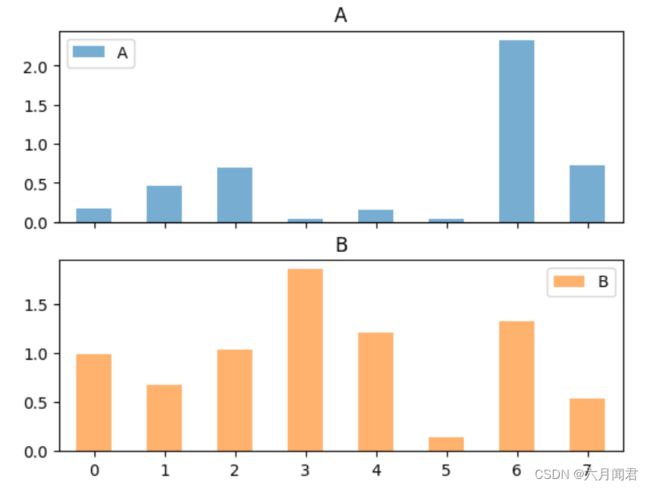
df = pd.DataFrame(abs(np.random.randn(8,2)), columns=['A','B'])
axes = df.plot.bar(rot=0, subplots=True, alpha=0.6)
axes[0].legend(loc='upper left')
axes[1].legend(loc='upper right')
plt.show()
axes[0].legend df.plot返回值是axes对象,分别设置对象的图示位置
2.barh
index = ['snail', 'pig', 'elephant','rabbit', 'giraffe', 'coyote', 'horse', 'cock']

df = pd.DataFrame(abs(np.random.randn(8,2)), columns=['A','B'],index=index)
ax = df.plot.barh(alpha=0.6)
简单的水平柱状图

ax = df.plot.barh(alpha=0.6,stacked=True,color={"A": "red", "B": "green"})
color={“A”: “red”, “B”: “green”} 分别设置两列数据不同颜色
水平堆积柱状图
