python-数据可视化-使用API
使用Web应用程序编程接口 (API)自动请求网站的特定信息而不是整个网页,再对这些信息进行可视化
使用Web API
Web API是网站的一部分,用于与使用具体URL请求特定信息的程序交互。这种请求称为API调用 。请求的数据将以易于处理的格式(如JSON或CSV)返回。依赖于外部数据源的大多数应用程序依赖于API调用,如集成社交媒体网站的应用程序
Git和GitHub
GitHub的名字源自Git,后者是一个分布式版本控制系统,帮助人们管理为项目所做的工作,避免一个人所做的修改影响其他人所做的修改。在项目中实现新功能时,Git跟踪你对每个文件所做的修改。确定代码可行后,你提交所做的修改,而Git将记录项目最新的状态。如果犯了错,想撤销所做的修改,你可以轻松地返回到以前的任何可行状态。(要更深入地了解如何使用Git进行版本控制,请参阅附录D。)GitHub上的项目都存储在仓库中,后者包含与项目相关联的一切:代码、项目参与者的信息、问题或bug报告,等等
在本章中,我们将编写一个程序,自动下载GitHub上星级最高的Python项目的信息,并对这些信息进行可视化
使用API调用请求数据
GitHub的API让你能够通过API调用来请求各种信息。要知道API调用是什么样的,请在浏览器的地址栏中输入如下地址
https://api.github.com/search/repositories?q=language:python&sort=star
https://api.github.com/search/repositories?q=language:python&sort=star
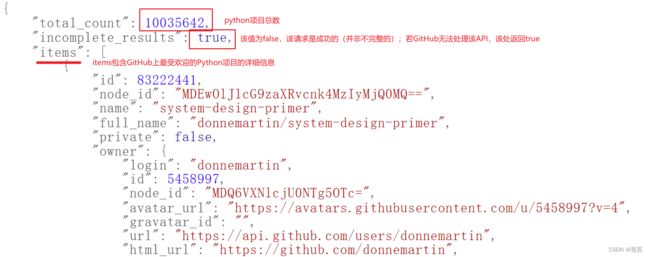
这个调用返回GitHub当前托管了多少个Python项目,以及有关最受欢迎的Python仓库的信息
https://api.github.com/ 将请求发送到GitHub网站中响应API调用的部分,接下来的search/repositories 让API搜索GitHub上的所有仓库
repositories 后面的问号指出需要传递一个实参。q 表示查询,而等号(= )让我们能够开始指定查询。我们使用language:python 指出只想获取主要语言为Python的仓库的信息。最后的&sort=stars 指定将项目按星级排序
安装requests
pip install requests
处理API响应
import requests
# 执行API调用并存储响应。
url = 'https://api.github.com/search/repositories?q=language:python&sort=stars'
headers = {'Accept': 'application/vnd.github.v3+json'}
r = requests.get(url, headers=headers)
print(f"Status code: {r.status_code}")	# Status code: 200
# 将API响应赋给一个变量。
response_dict = r.json()
# 处理结果。
print(response_dict.keys())	# dict_keys(['total_count', 'incomplete_results', 'items'])
状态码200表示请求成功
方法json() 将这些信息转换为一个Python字典
处理响应字典
# 将API响应赋给一个变量。
response_dict = r.json()
print(f"Total repositories: {response_dict['total_count']}")	# 9420397	# 仓库总数
# 探索有关仓库的信息。
repo_dicts = response_dict['items']
print(f"Repositories returned: {len(repo_dicts)}")	# 30	# 返回30个仓库
# 研究第一个仓库。
repo_dict = repo_dicts[0]
print(f"\nKeys: {len(repo_dict)}")	# Keys: 80	# repo_dict 包含80个键
for key in sorted(repo_dict.keys()):
    print(key)
提取repo_dict 中与一些键相关联的值
print("\nSelected information about first repository:") # Selected information about first repository:
print(f"Name: {repo_dict['name']}")                     # Name: flask
print(f"Owner: {repo_dict['owner']['login']}")          # Owner: pallets
print(f"Stars: {repo_dict['stargazers_count']}")        # Stars: 63955
print(f"Repository: {repo_dict['html_url']}")           # Repository: https://github.com/pallets/flask
print(f"Created: {repo_dict['created_at']}")            # Created: 2010-04-06T11:11:59Z
print(f"Updated: {repo_dict['updated_at']}")            # Updated: 2023-08-27T04:37:37Z
print(f"Description: {repo_dict['description']}")       # Description: The Python micro framework for building web applications.
owner login 所有者登录名
概述最受欢迎的仓库
# 研究有关仓库的信息。
repo_dicts = response_dict['items']
print(f"Repositories returned: {len(repo_dicts)}")

print("\nSelected information about each repository:")
for repo_dict in repo_dicts:
    print(f"\nName: {repo_dict['name']}")
    print(f"Owner: {repo_dict['owner']['login']}")
    print(f"Stars: {repo_dict['stargazers_count']}")
    print(f"Repository: {repo_dict['html_url']}")
    print(f"Description: {repo_dict['description']}")
代码结果如下:
Repositories returned: 30

Selected information about each repository:

Name: flask
Owner: pallets
Stars: 63955
Repository: https://github.com/pallets/flask
Description: The Python micro framework for building web applications.

Name: langchain
Owner: langchain-ai
Stars: 60009
Repository: https://github.com/langchain-ai/langchain
Description: ⚡ Building applications with LLMs through composability ⚡

Name: ailearning
Owner: apachecn
Stars: 36223
Repository: https://github.com/apachecn/ailearning
Description: AiLearning:数据分析+机器学习实战+线性代数+PyTorch+NLTK+TF2

Name: linux-insides
Owner: 0xAX
Stars: 28546
Repository: https://github.com/0xAX/linux-insides
Description: A little bit about a linux kernel
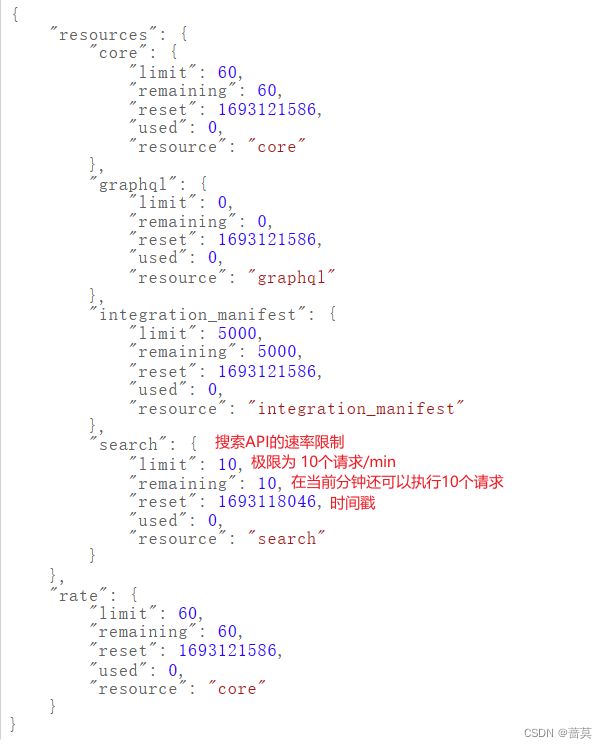
监视API的速率限制
大多数API存在速率限制,也就是说,在特定时间内可执行的请求数存在限制
要获悉是否接近了GitHub的限制,请在浏览器中输入https://api.github.com/rate_limit,你将看到类似于下面的响应:https://api.github.com/rate_limit
注意:很多API要求注册获得API密钥后才能执行API调用
使用Plotly可视化仓库
import requests
from plotly.graph_objs import Bar
from plotly import offline
# 执行API调用并存储响应。
url = 'https://api.github.com/search/repositories?q=language:python&sort=stars'
headers = {'Accept': 'application/vnd.github.v3+json'}
r = requests.get(url, headers=headers)
print(f"Status code: {r.status_code}")
# 处理结果。
response_dict = r.json()
repo_dicts = response_dict['items']
repo_names, stars = [], []
for repo_dict in repo_dicts:
repo_names.append(repo_dict['name'])
stars.append(repo_dict['stargazers_count'])
# 可视化。
data = [{
'type': 'bar',
'x': repo_names,
'y': stars,
}]
my_layout = {
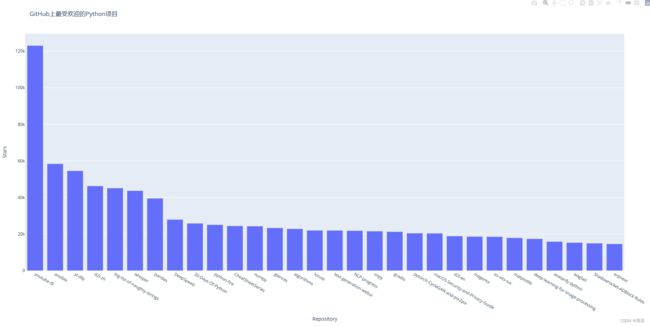
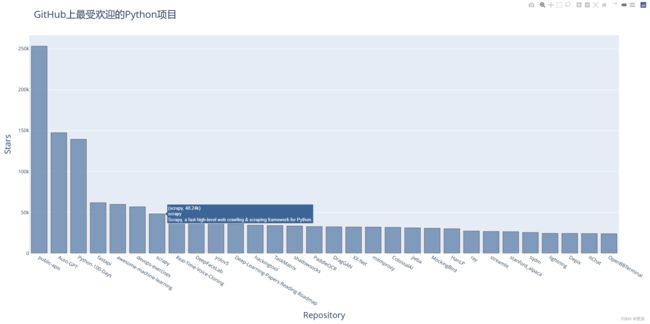
'title': 'GitHub上最受欢迎的Python项目',
'xaxis': {'title': 'Repository'},
'yaxis': {'title': 'Stars'},
}
fig = {'data': data, 'layout': my_layout}
offline.plot(fig, filename='python_repos.html')
改进Plotly图表 data my_layout
可在data 和my_layout 中以键值对的形式指定各种样式
data修改图表
my_layout修改字
data = [{
    'type': 'bar',
    'x': repo_names,
    'y': stars,
    'marker': {
        'color': 'red',
        'line': {'width': 1.5, 'color': 'rgb(25, 25, 25)'}
    },
    'opacity': 0.6,
}]
my_layout = {
    'title': 'GitHub上最受欢迎的Python项目',
    'titlefont': {'size': 28},
    'xaxis': {
        'title': 'Repository',
        'titlefont': {'size': 24},
        'tickfont': {'size': 14},
    },
    'yaxis': {
        'title': 'Stars',
        'titlefont': {'size': 24},
        'tickfont': {'size': 14},
    },
}
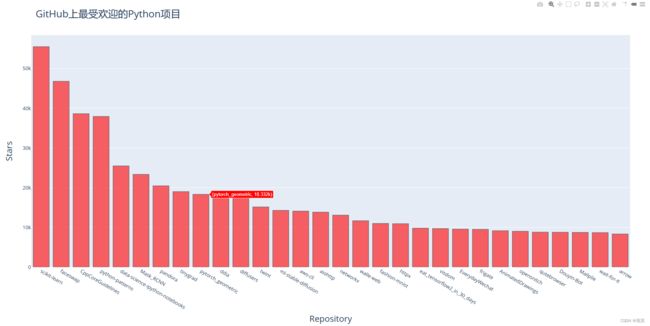
添加自定义工具提示 hovertext
工具提示:将鼠标指向条形将显示其表示的信息
# 处理结果。
response_dict = r.json()
repo_dicts = response_dict['items']
repo_names, stars, labels = [], [], []
for repo_dict in repo_dicts:
    repo_names.append(repo_dict['name'])
    stars.append(repo_dict['stargazers_count'])

    owner = repo_dict['owner']['login']
    description = repo_dict['description']
    label = f"{owner}
{description}"
    labels.append(label)
# 可视化。
data = [{
    'type': 'bar',
    'x': repo_names,
    'y': stars,
    'hovertext': labels,
    'marker': {
        'color': 'rgb(60, 100, 150)',
        'line': {'width': 1.5, 'color': 'rgb(25, 25, 25)'}
    },
    'opacity': 0.6,
}]
Plotly允许在文本元素中使用HTML代码
在图表中添加可单击的链接
点击图表底端的项目名,可以访问项目在GitHub上的主页
# 处理结果。
response_dict = r.json()
repo_dicts = response_dict['items']
repo_links, stars, labels = [], [], []
for repo_dict in repo_dicts:
    repo_name = repo_dict['name']
    repo_url = repo_dict['html_url']
    repo_link = f"{repo_name}"
    repo_links.append(repo_link)
    stars.append(repo_dict['stargazers_count'])

    owner = repo_dict['owner']['login']
    description = repo_dict['description']
    label = f"{owner}
{description}"
    labels.append(label)
将data里x的值改为repo_links
data = [{
    'x': repo_links,
}]
深入了解Plotly和GitHub API
想要深入了解如何生成Plotly图表,可以看Plotly User Guide in Python和Python Figure Reference
Hacker News API
Hacker News网站:Hacker News的API让你能够访问有关该网站所有文章和评论的信息,且不要求通过注册获得密钥
import requests
import json
# 执行API调用并存储响应。
url = 'https://hacker-news.firebaseio.com/v0/item/19155826.json'
r = requests.get(url)
print(r.status_code)# 200
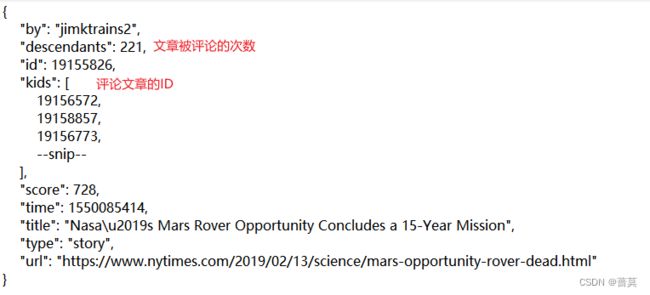
# 探索数据的结构。
response_dict = r.json()
readable_file = 'readable_hn_data.json'
with open(readable_file, 'w') as f:
json.dump(response_dict, f, indent=4)
下面的URL返回一个列表,其中包含Hacker News上当前排名靠前的文章的ID:
https://hacker-news.firebaseio.com/v0/topstories.json
from operator import itemgetter
import requests

# 执行API调用并存储响应。
url = 'https://hacker-news.firebaseio.com/v0/topstories.json'
r = requests.get(url)
# print(f"Status code: {r.status_code}")

# 处理有关每篇文章的信息。
submission_ids = r.json()
submission_dicts = []
for submission_id in submission_ids[:10]:
    # 对于每篇文章,都执行一个API调用。
    url = f"https://hacker-news.firebaseio.com/v0/item/{submission_id}.json"
    r = requests.get(url)
    # print(f"id: {submission_id}\tstatus: {r.status_code}")
    response_dict = r.json()

    # 对于每篇文章,都创建一个字典。
    submission_dict = {
        'title': response_dict['title'],
        'hn_link': f"http://news.ycombinator.com/item?id={submission_id}",
        'comments': response_dict['descendants'],
    }
    submission_dicts.append(submission_dict)

submission_dicts = sorted(submission_dicts, key=itemgetter('comments'),reverse=True)

for submission_dict in submission_dicts:
    print(f"\nTitle: {submission_dict['title']}")
    print(f"Discussion link: {submission_dict['hn_link']}")
    print(f"Comments: {submission_dict['comments']}")