Schedule + Pyecharts | 时间序列图(动态轮播图)
文章目录
- 前言
- 1. 导入模块
-
- 1.1 schedule模块示例
- 1.2 其他定时周期
- 2. 爬取知乎热榜数据
- 3. 爬取微博热搜数据
- 4. 时间序列图(动态轮播图)
-
- 4.1 一个简单的例子(NBA球员数据)
- 4.2 微博热搜数据时序图
-
- 4.2.1 基础时间序列图
- 4.2.2 调整图布边距
- 4.2.3 定制主题,增加图标,设置播放速度
- 4.3 知乎热榜数据时序图
- 推荐阅读
前言
大家好,我是 【Python当打之年】
本期利用schedule模块定时采集知乎热榜/微博热搜数据,用pandas进行数据处理,用pyecharts的Timeline进行热榜数据动态轮播展示(时间序列图),希望对小伙伴们有所帮助,如有疑问或者需要改进的地方也可以在评论区留言。
涉及到的内容:
schedule — 定时任务
read_html — 网页数据采集
Pandas — 数据处理
Pyecharts — 数据可视化
先看一下效果:
1. 导入模块
import time
import schedule
import json
import requests
import pandas as pd
from pyecharts import options as opts
from pyecharts.charts import Bar, Timeline, Grid
from pyecharts.globals import ThemeType
以上模块如果没有的话,直接pip安装即可。
1.1 schedule模块示例
演示时设置运行3次退出,使用过程中,大家根据需要设置即可,一般作服务端时不设置。
count = 0
def work():
    global count
    count += 1
    author = 'Python当打之年'
    time_mow = time.strftime("%Y-%m-%d %H:%M:%S", time.localtime())
    print(f'{time_mow} -- {author}')
每5秒执行一次:
schedule.every(5).seconds.do(work)
while True:
    if count > 2:
        schedule.clear()
        break
    schedule.run_pending()
    time.sleep(1)
每1分钟执行一次:
count = 0
schedule.every(1).minutes.do(work)
while True:
    if count > 2:
        schedule.clear()
        break
    schedule.run_pending()
    time.sleep(1)
1.2 其他定时周期
每1分钟执行一次任务:
schedule.every(1).minutes.do(work)
每小时执行一次任务:
schedule.every().hour.do(work)
每天在什么时间点执行一次任务:
schedule.every().day.at('10:30').do(work)
每10-20分钟(随机)执行一次任务:
schedule.every(10).to(20).minutes.do(work)
每周一执行一次任务:
schedule.every().monday.do(work)
每周一什么时间点执行一次任务:
schedule.every().monday.at('09:30').do(work)
每分钟在第45秒的时候执行任务:
schedule.every().minute.at(':45').do(work)
2. 爬取知乎热榜数据
# 网址
zhihu_url = 'https://api.zhihu.com/topstory/hot-list?limit=10&reverse_order=0'
# 伪装请求头
headers = {'User-Agent':'Mozilla/5.0 (Windows NT 10.0; WOW64) AppleWebKit/537.36 (KHTML, like Gecko) Chrome/78.0.3904.108 Safari/537.36 QIHU 360SE'}
# 是否加表头
zhihu_csv_header = True
# 计次
zhihu_count = 0
爬取数据:
def getzhihudata(url, headers):
    r = requests.get(url, headers=headers)
    r.raise_for_status()
    r.encoding = r.apparent_encoding
    datas = json.loads(r.text)['data']
    allinfo = []
    time_mow = time.strftime("%Y-%m-%d %H:%M", time.localtime())
    print(time_mow)
    for indx,item in enumerate(datas):
        title = item['target']['title']
        heat = item['detail_text'].split(' ')[0]
        answer_count = item['target']['answer_count']
        follower_count = item['target']['follower_count']
        href = item['target']['url']
        info = [time_mow, indx+1, title, heat, answer_count, follower_count, href]
        allinfo.append(info)
    # 仅首次加表头
    global zhihu_csv_header
    df = pd.DataFrame(allinfo,columns=['时间','排名','标题','热度(万)','回答数','关注数','链接'])
    print(df.head())
    df.to_csv('zhuhu_hot_datas.csv', mode='a+', index=False, header=zhihu_csv_header)
    zhihu_csv_header = False
    global zhihu_count
    zhihu_count += 1
getzhihudata(zhihu_url, headers)
效果:

作为演示这里设置每1分钟执行一次爬取任务,爬取3次,大家在本地运行时可以设置5分钟或者10分钟采集一次,循环次数设置30次左右,这样数据量不至于过多或过少。
3. 爬取微博热搜数据
def getweibodata():
    url = 'https://s.weibo.com/top/summary'
    r = requests.get(url, timeout=10)
    r.encoding = r.apparent_encoding
    df = pd.read_html(r.text)[0]
    df = df.loc[1:,['序号', '关键词']]
    df = df[~df['序号'].isin(['•'])]
    time_mow = time.strftime("%Y-%m-%d %H:%M", time.localtime())
    print(time_mow)
    df['时间'] = [time_mow] * df.shape[0]
    df['排名'] = df['序号'].apply(int)
    df['标题'] = df['关键词'].str.split('  ', expand=True)[0]
    df['热度'] = df['关键词'].str.split('  ', expand=True)[1]
    df = df[['时间','排名','标题','热度']]
    print(df.head())
    # 仅首次加表头
    global weibo_csv_header
    df.to_csv('weibo_hot_datas.csv', mode='a+', index=False, header=weibo_csv_header)
    weibo_csv_header = False
getweibodata()
4. 时间序列图(动态轮播图)
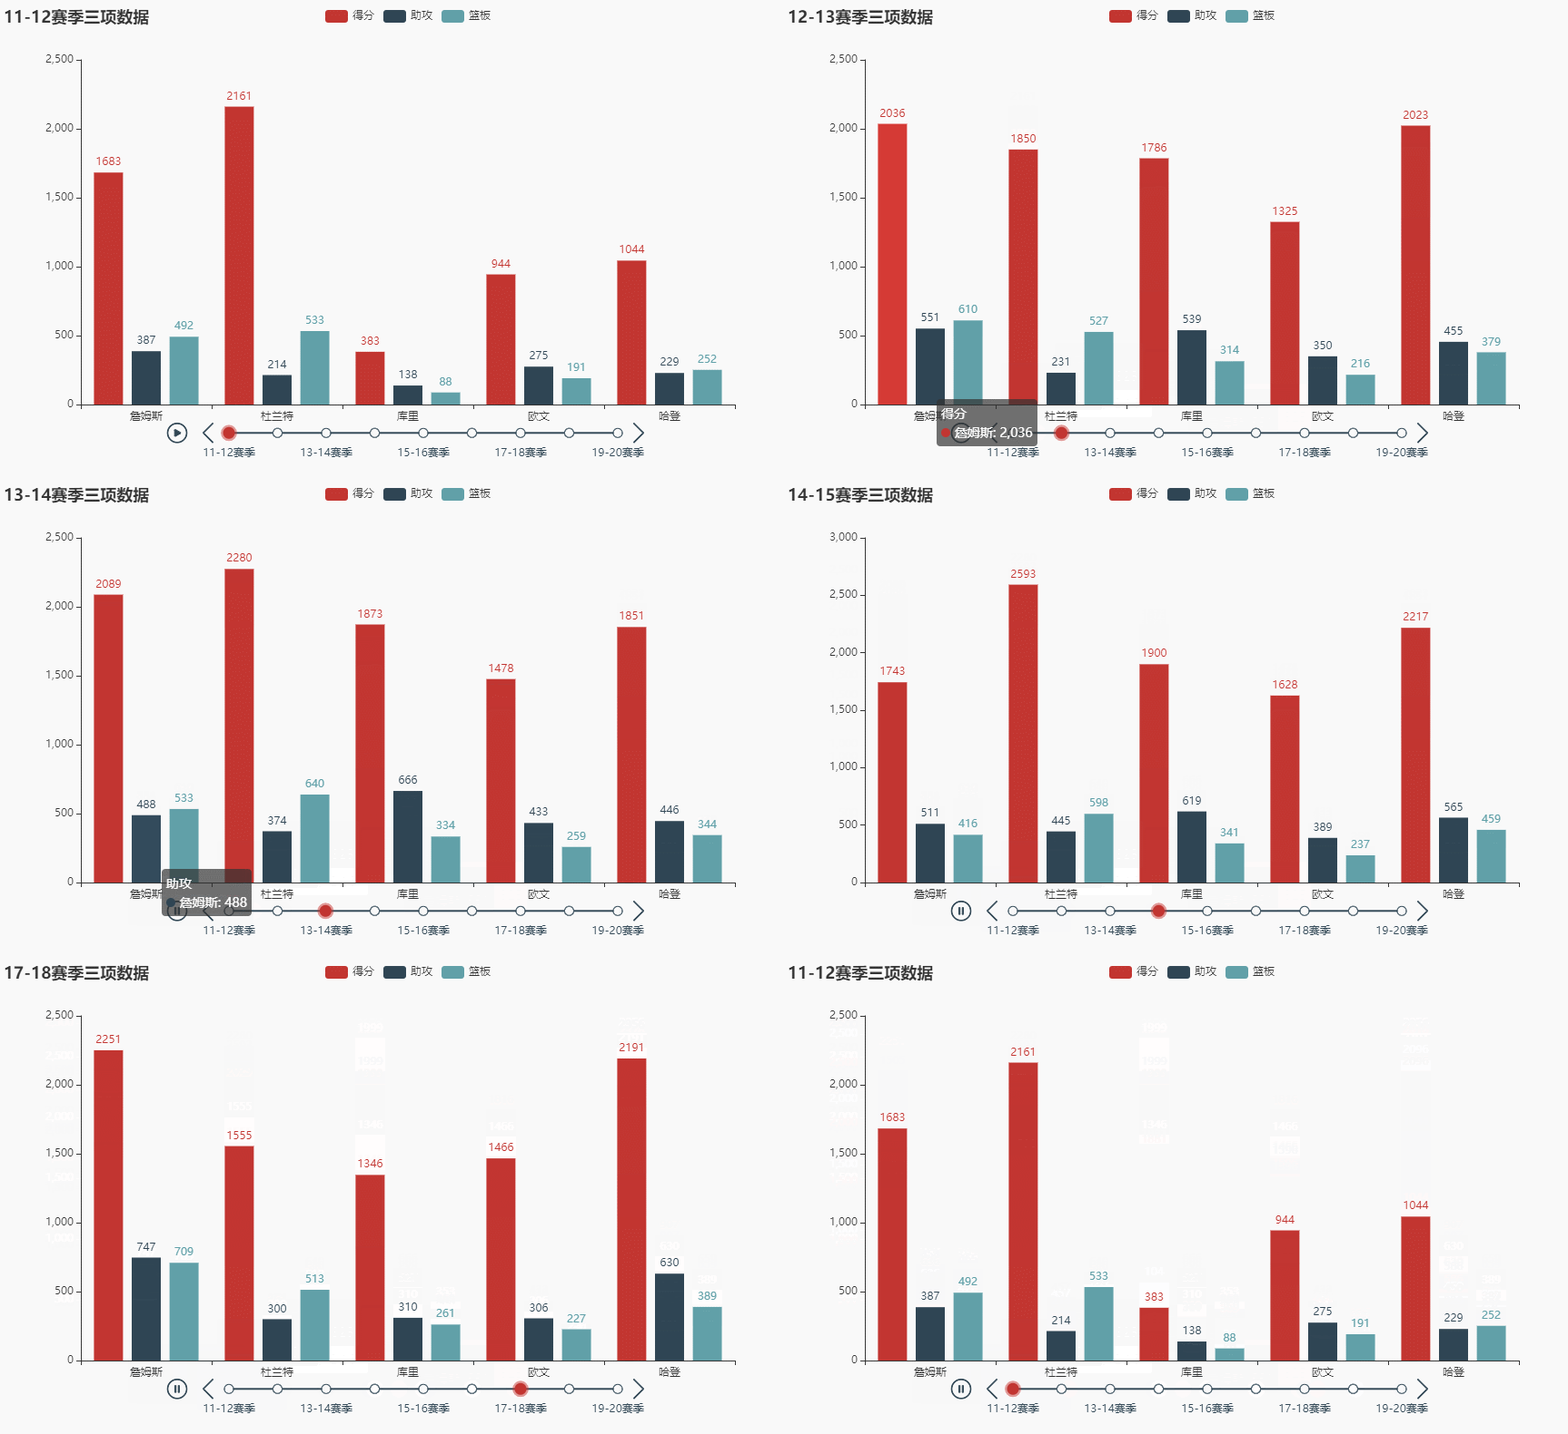
4.1 一个简单的例子(NBA球员数据)
数据:
names = ['詹姆斯', '杜兰特', '库里', '欧文', '哈登']
allinfo = [[[492, 610, 533, 416, 565, 639, 709, 465, 472], [387, 551, 488, 511, 514, 646, 747, 454, 636], [1683, 2036, 2089, 1743, 1920, 1954, 2251, 1505, 1544]], [[533, 527, 640, 598, 178, 589, 513, 464, 497], [214, 231, 374, 445, 110, 361, 300, 366, 457], [2161, 1850, 2280, 2593, 686, 2029, 1555, 1792, 2027]], [[88, 314, 334, 341, 430, 353, 261, 369, 26], [138, 539, 666, 619, 527, 524, 310, 361, 33], [383, 1786, 1873, 1900, 2375, 1999, 1346, 1881, 104]], [[191, 216, 259, 237, 157, 230, 227, 335, 103], [275, 350, 433, 389, 250, 418, 306, 464, 128], [944, 1325, 1478, 1628, 1041, 1816, 1466, 1596, 548]], [[252, 379, 344, 459, 501, 659, 389, 518, 387], [229, 455, 446, 565, 612, 907, 630, 586, 450], [1044, 2023, 1851, 2217, 2376, 2356, 2191, 2818, 2096]]]
时序图:
y1 = []
y2 = []
y3 = []
for i in range(9):
    y_trb_sorce = []
    y_ast_sorce = []
    y_pts_sorce = []
    for j in range(5):
        y_trb_sorce.append(allinfo[j][0][i])
        y_ast_sorce.append(allinfo[j][1][i])
        y_pts_sorce.append(allinfo[j][2][i])
    y1.append(y_pts_sorce)
    y2.append(y_ast_sorce)
    y3.append(y_trb_sorce)

years = ['11-12赛季', '12-13赛季', '13-14赛季', '14-15赛季', '15-16赛季', '16-17赛季', '17-18赛季', '18-19赛季', '19-20赛季']
tl = Timeline()
for i in range(9):
    bar = (
        Bar()
            .add_xaxis(names)
            .add_yaxis('得分', y1[i])
            .add_yaxis('助攻', y2[i])
            .add_yaxis('篮板', y3[i])
            .set_global_opts(title_opts=opts.TitleOpts("{}三项数据".format(years[i])))
    )
    tl.add(bar, "{}".format(years[i]))
tl.render_notebook()
4.2 微博热搜数据时序图
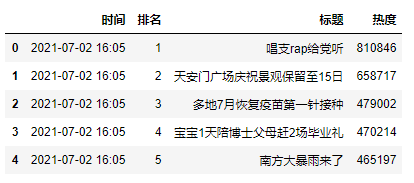
读取数据:
weibo_data = pd.read_csv('weibo_hot_datas.csv')
weibo_data.head()
4.2.1 基础时间序列图
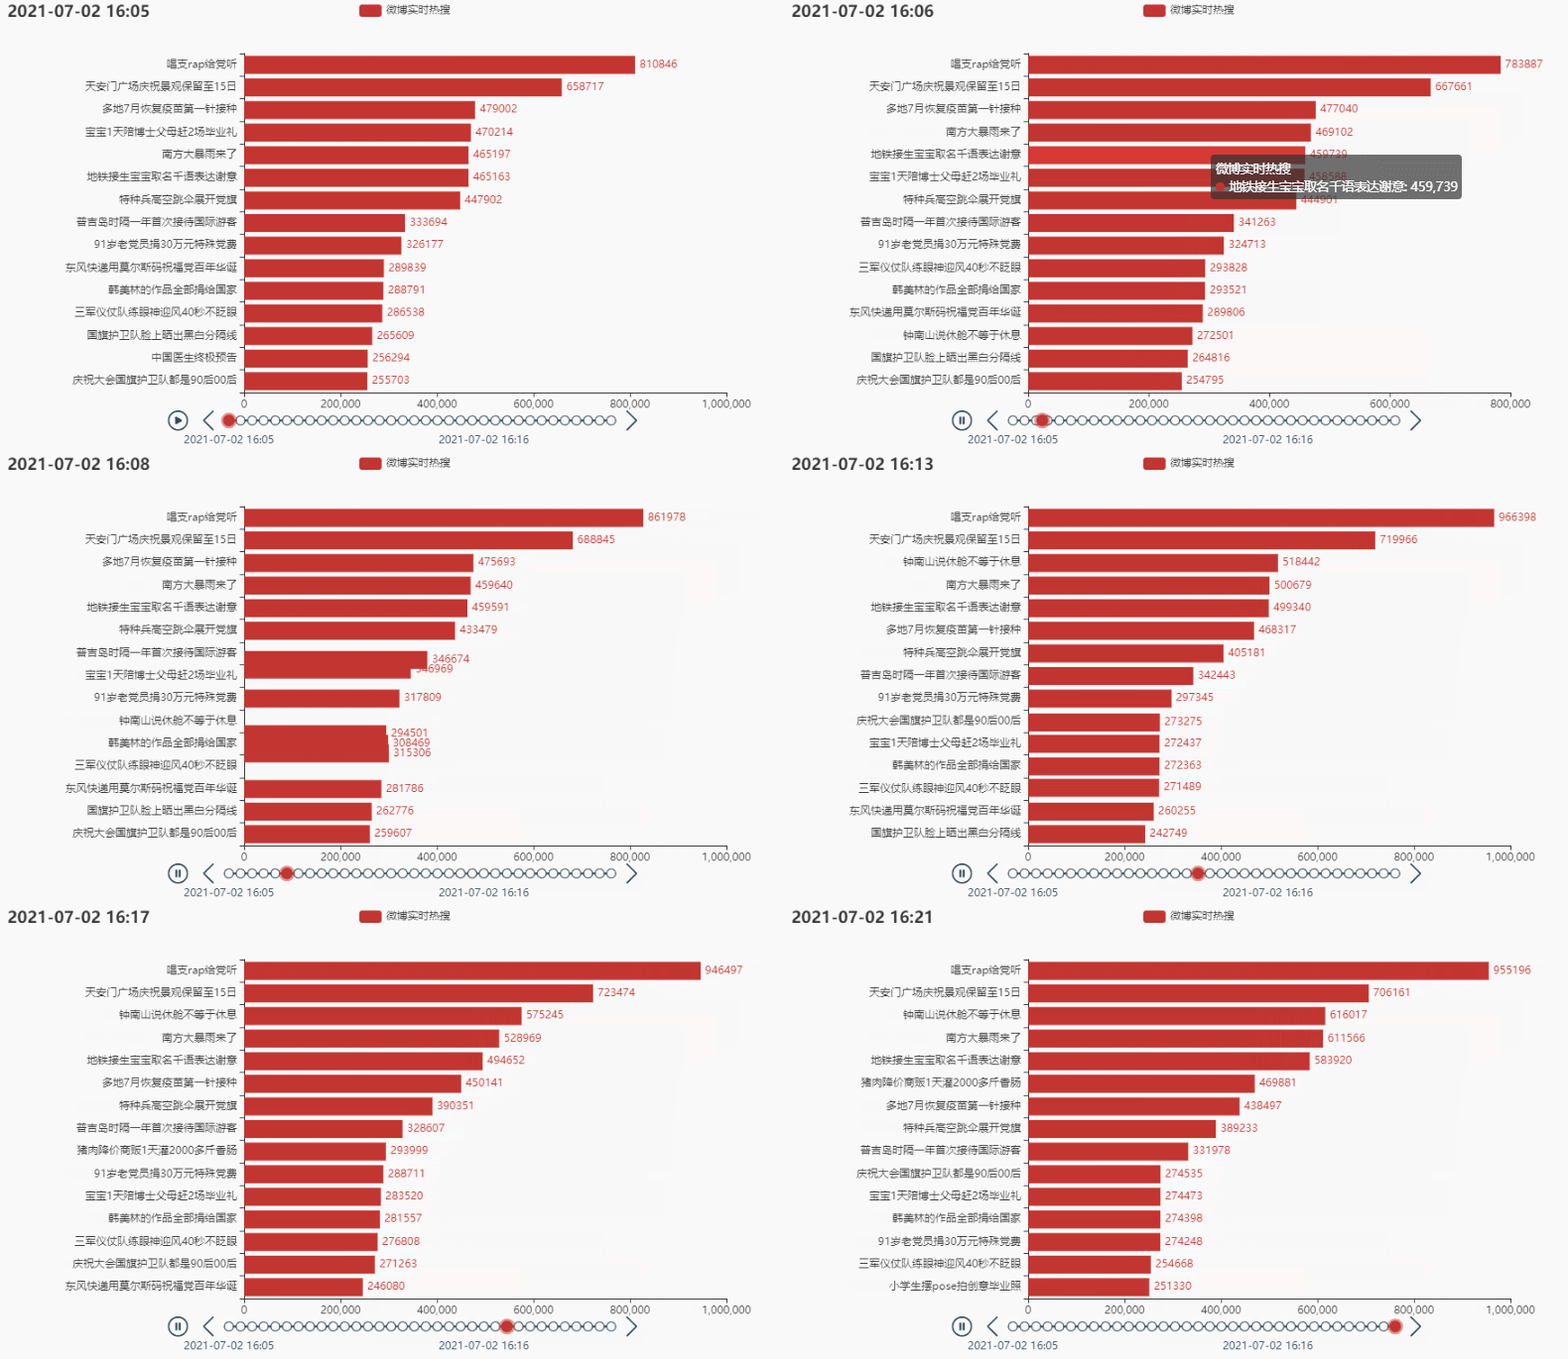
取排名前15的热点:
tl = Timeline()
count = 50
time_data_counts = int(weibo_data.shape[0]/count)
times = weibo_data['时间'].values.tolist()
for i in range(time_data_counts):
    bar = (
        Bar()
            .add_xaxis(list(weibo_data['标题'])[i*count:i*count+15][::-1])
            .add_yaxis('微博热搜', list(weibo_data['热度'])[i*count:i*count+15][::-1])
            .reversal_axis()
            .set_global_opts(title_opts=opts.TitleOpts('{}'.format(times[i*count])))
    )
    tl.add(bar, "{}".format(times[i*count]))
tl.render_notebook()
4.2.2 调整图布边距
# 将图形整体右移
grid = (
    Grid()
    .add(bar, grid_opts=opts.GridOpts(pos_left='30%', pos_right='10%'))
)
tl.add(bar, "{}".format(times[i*count]))
tl.add(grid, '')
这样就比较正常一些了,也可以显示微博热搜排名后15条的数据。
4.2.3 定制主题,增加图标,设置播放速度
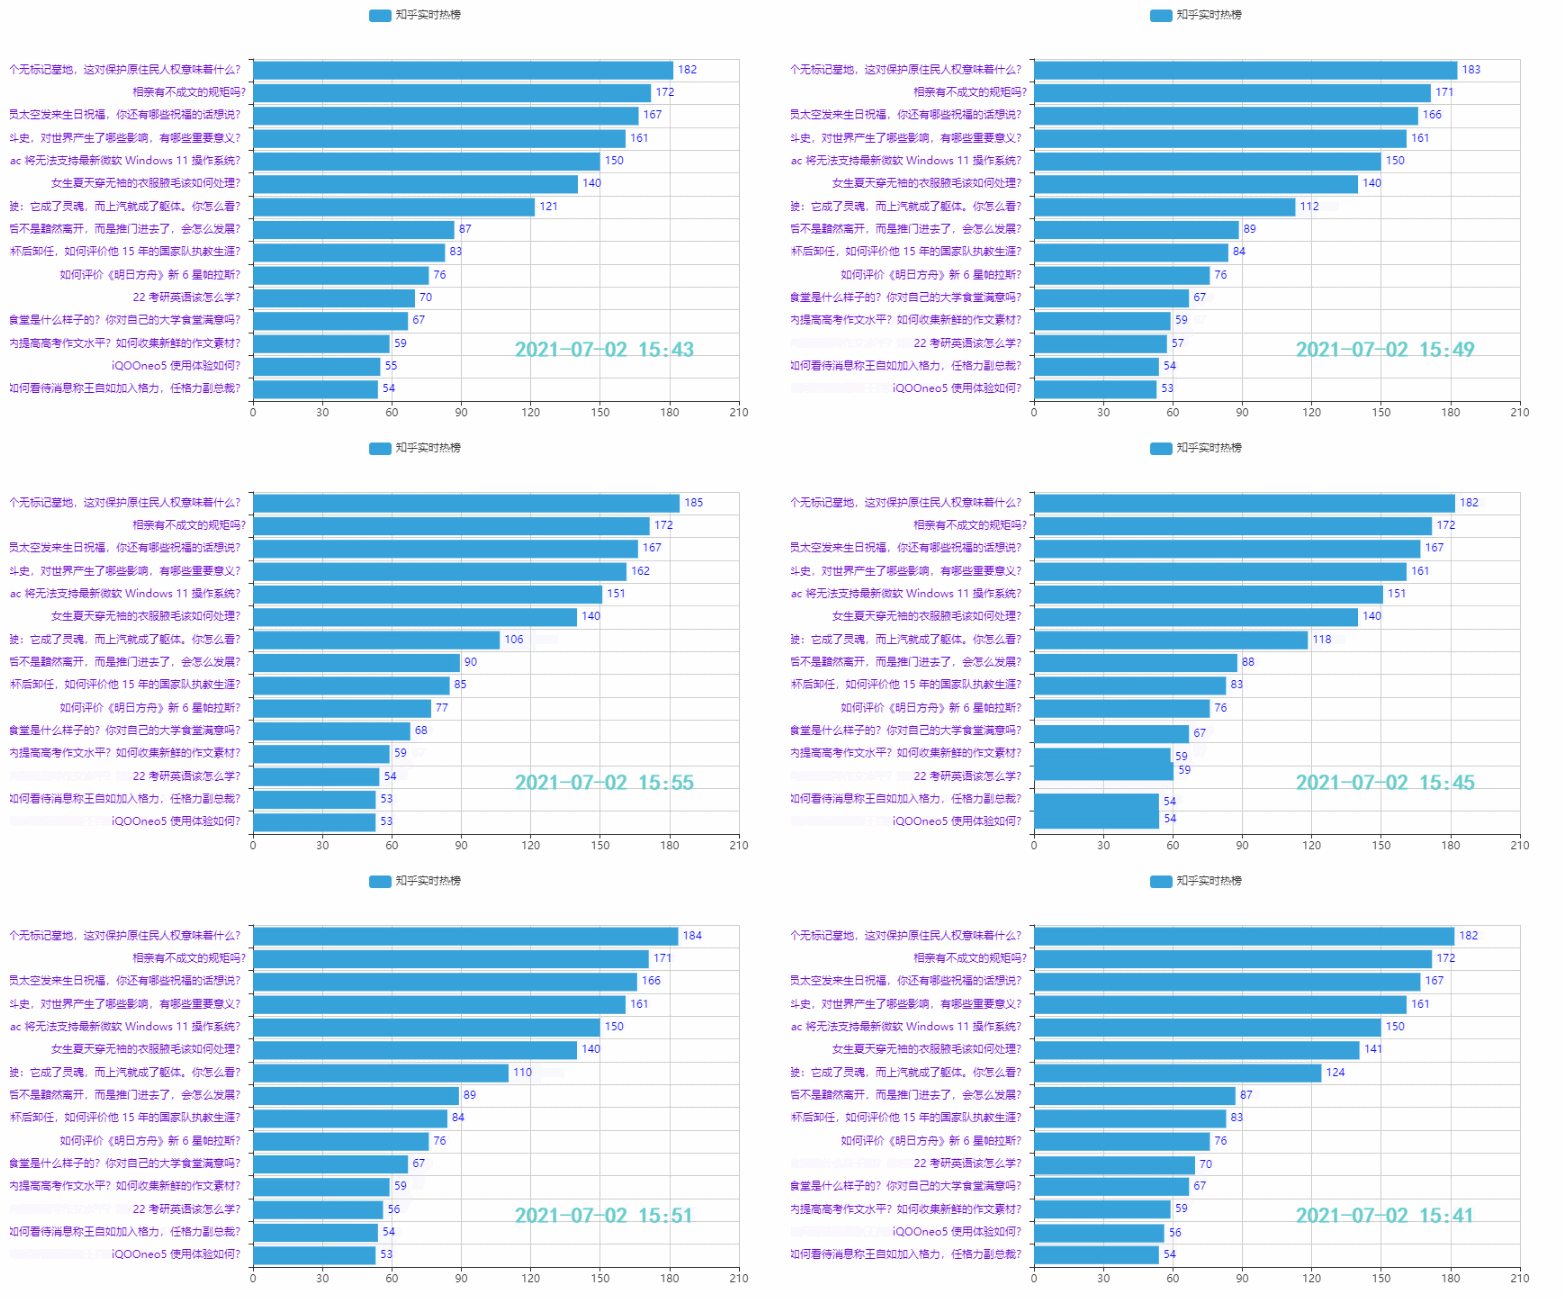
4.3 知乎热榜数据时序图
本期主要是给小伙伴们提供一个制作时序图的思路,代码重复比较多,部分代码就没贴出来了,如果需要可以点击下面链接查看所有代码,也可以在线运行:
【Schedule + Pyecharts | 时间序列图(动态轮播图)】
以上就是本期为大家整理的全部内容了,赶快练习起来吧,原创不易,喜欢的朋友可以点赞、收藏也可以分享让更多人知道哦
推荐阅读
Pandas+Pyecharts | 北京某平台二手房数据分析+可视化
Pandas+Pyecharts | 2021中国大学综合排名分析+可视化
可视化 | Python绘制高颜值台风地理轨迹图
可视化 | 用Python分析近5000个旅游景点,告诉你假期应该去哪玩
可视化 | Python精美地图动态展示近20年全国各省市GDP
可视化 | Python陪你过520:在你身边,你在身边
爬虫 | Python送你王者荣耀官网全套皮肤
爬虫 | 用python构建自己的IP代理池,再也不担心IP不够用啦!
技巧 | 20个Pycharm最实用最高效的快捷键(动态展示)
技巧 | 5000字超全解析Python三种格式化输出方式【% / format / f-string】
技巧 | python定时发送邮件(自动添加附件)
爬虫 | Python送你王者荣耀官网全套皮肤
爬虫 | 用python构建自己的IP代理池,再也不担心IP不够用啦!
文章首发微信公众号 “Python当打之年” ,每天都有python编程技巧推送,希望大家可以喜欢
![]()


