基于空洞卷积DCNN与长短期时间记忆模型LSTM的dcnn-lstm的回归预测模型
周末的时候有时间鼓捣的一个小实践,主要就是做的多因子回归预测的任务,关于时序数据建模和回归预测建模我的专栏和系列博文里面已经有了非常详细的介绍了,这里就不再多加赘述了,这里主要是一个模型融合的实践,这里的数据是仿真生成的领域数据集,典型的表格型数据集,首先看下数据样例:
基础的数据处理实现如所示:
import pandas as pd

# 读取 "data" 工作表的内容
sheet_name = "data"
data = pd.read_excel("dataset.xlsx", sheet_name=sheet_name)

# 删除第一列日期列
data1= data.iloc[:, 1:]

print(data1.head(20))
接下来随机划分数据集,实现如下所示:
from sklearn.model_selection import train_test_split
X = data.drop(columns=['Y'])  # 这将删除名为'label'的列,并返回其余部分
y = data['Y']
x_train, x_test, y_train, y_test = train_test_split(X, y, test_size=0.2, random_state=42)
接下来对数据进行归一化处理计算,如下所示:
# 创建特征标准化的对象
scaler = StandardScaler()  # 或者使用 MinMaxScaler() 来进行 Min-Max 缩放

# 训练标准化对象并转换训练特征
x_train_scaled = scaler.fit_transform(x_train)

# 假设你有测试数据 x_test 和 y_test,对测试特征进行相同的变换
x_test_scaled = scaler.transform(x_test)

# 输出尺寸
print("训练特征(标准化后)的尺寸:", x_train_scaled.shape)
print("测试特征(标准化后)的尺寸:", x_test_scaled.shape)
print("特征列(x_train)的尺寸:", x_train.shape)
print("标签列(y_train)的尺寸:", y_train.shape)
print("特征列(x_test)的尺寸:", x_test.shape)
print("标签列(y_test)的尺寸:", y_test.shape)
接下来是数据转化处理:
def reshape_to_window(data, window=window):
    """
    数据转化
    """
    n = data.shape[0]
    m = data.shape[1]
    result = np.zeros((n - window + 1, window, m))
    for i in range(n - window + 1):
        result[i] = data[i:i+window]
    return result


x_train = reshape_to_window(x_train, window)
y_train = y_train.iloc[window-1:]

x_test = reshape_to_window(x_test, window)
y_test = y_test.iloc[window-1:]

print("新的x_train形状:", x_train .shape )
print("新的y_train形状:", y_train .shape)
print("新的x_test形状:", x_test.shape)
print("新的y_test形状:", y_test.shape)
接下来基于keras框架初始化搭建模型,这里模型部分主要是运用了DCNN和LSTM,对其进行融合。首先来整体回归下DCNN和LSTM:
DCNN
空洞卷积(dilated convolution)是一种卷积神经网络(Convolutional Neural Network, CNN)中的卷积操作,它通过在卷积核上添加空洞(dilation)来扩展感受野(receptive field),从而提高模型的鲁棒性和泛化能力。
在传统的卷积操作中,卷积核只能覆盖一小部分特征图,但是通过在卷积核上添加空洞,可以让卷积核在相邻的特征图之间滑动,从而扩展了卷积核的感受野,增强了模型的表达能力。空洞卷积的基本原理是将传统卷积操作的滑动步长(stride)设置为1,然后将卷积核的大小(kernel size)除以2,使得卷积核中心点能够与特征图上任意位置的像素进行卷积运算。
在空洞卷积中,每个卷积层都具有不同数量的空洞率(dilation rate),表示在每个卷积层中添加的空洞数量。空洞率越高,则卷积核的感受野越大,能够提取更多的特征信息。但是,空洞率过高会导致特征图变得稀疏,难以捕捉到细节信息。因此,在空洞卷积中需要权衡空洞率和特征图的稀疏性。
空洞卷积在深度卷积神经网络中可以应用于多个任务,例如图像分类、目标检测、语义分割等。相比于传统的卷积操作,空洞卷积能够提高模型的鲁棒性和泛化能力,同时减少计算量和参数数量,使得模型更加轻量级和高效。
LSTM
LSTM(Long Short-Term Memory)是一种循环神经网络(RNN)的变体,特别适用于处理序列数据。相较于传统的RNN,LSTM在处理时间序列数据时具有更好的性能和稳定性。
LSTM由遗忘门(forget gate)、输入门(input gate)、输出门(output gate)和存储单元(cell state)组成。遗忘门决定了前一时刻的记忆状态中哪些信息应该被遗忘,输入门决定了当前输入的信息中哪些应该被用于计算输出,输出门决定了当前时刻的输出,而存储单元则用于存储和输出当前时刻的记忆状态。
LSTM的核心思想是通过遗忘门和输入门来控制信息的流动,从而在长期依赖和短期依赖之间取得平衡。遗忘门和输入门都是由sigmoid函数和线性层组成的,而输出门则是由sigmoid函数、线性层和ReLU函数组成的。这些门控制了信息的流动方向和强度,使得LSTM能够处理长期依赖关系。
除了LSTM之外,还有GRU(Gated Recurrent Unit)和SRU(Simple Recurrent Unit)等循环神经网络变体,它们在结构和性能上与LSTM类似。LSTM在自然语言处理、语音识别、图像处理等领域都有广泛的应用。
模型部分代码实现如下所示:
from tensorflow.keras import backend as K

# # 输入参数

input_size = 176  # 你的输入尺寸
lstm_units =16# 你的LSTM单元数
dropout = 0.01    # 你的dropout率

# 定义模型结构
inputs = Input(shape=(window, input_size))

# 第一层空洞卷积
model = Conv1D(filters=lstm_units, kernel_size=1, dilation_rate=1, activation='relu')(inputs)
# model = MaxPooling1D(pool_size=1)(model)
# model = Dropout(dropout)(model)

# 第二层空洞卷积
model = Conv1D(filters=lstm_units, kernel_size=1, dilation_rate=2, activation='relu')(model)
# model = MaxPooling1D(pool_size=1)(model)

# 第三层空洞卷积
model = Conv1D(filters=lstm_units, kernel_size=1, dilation_rate=4, activation='relu')(model)
# model = MaxPooling1D(pool_size=1)(model)
# model = BatchNormalization()(model)

# LSTM层
model = LSTM(lstm_units, return_sequences=False)(model)

# 输出层
outputs = Dense(1)(model)

# 创建和编译模型
model = Model(inputs=inputs, outputs=outputs)

model.compile(loss='mse', optimizer='adam', metrics=['mse'])
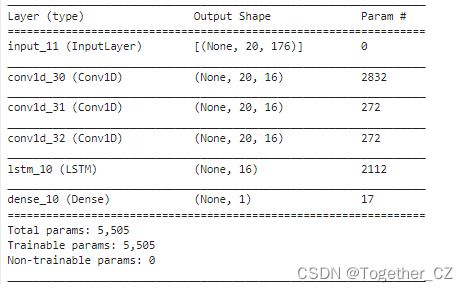
model.summary()
摘要输出如下所示:
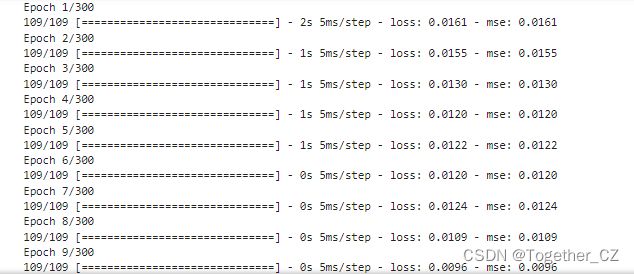
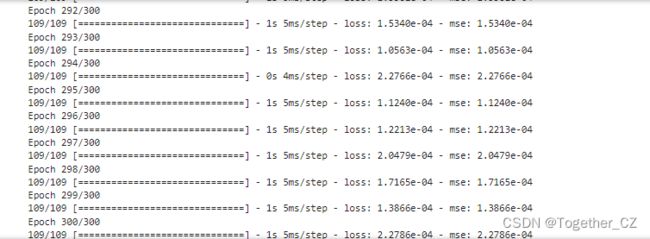
接下来就可以启动模型训练,日志输出如下所示:
接下来对模型整体训练过程中的loss进行可视化,如下所示:
plt.figure(figsize=(12, 6))
plt.plot(history.history['loss'], label='Training Loss')
plt.title('Model loss')
plt.ylabel('Loss')
plt.xlabel('Epoch')
plt.legend(loc='upper right')
plt.show()
结果如下所示:
接下来对测试集进行预测对比分析,如下所示:
explained_variance_score:解释回归模型的方差得分,其值取值范围是[0,1],越接近于1说明自变量越能解释因变量
的方差变化,值越小则说明效果越差。
mean_absolute_error:平均绝对误差(Mean Absolute Error,MAE),用于评估预测结果和真实数据集的接近程度的程度
,其其值越小说明拟合效果越好。
mean_squared_error:均方差(Mean squared error,MSE),该指标计算的是拟合数据和原始数据对应样本点的误差的
平方和的均值,其值越小说明拟合效果越好。
r2_score:判定系数,其含义是也是解释回归模型的方差得分,其值取值范围是[0,1],越接近于1说明自变量越能解释因
变量的方差变化,值越小则说明效果越差。
基于回归模型评测指标对模型进行评估计算,核心代码实现如下所示:
#!usr/bin/env python
#encoding:utf-8
from __future__ import division


'''
__Author__:沂水寒城
功能:计算回归分析模型中常用的四大评价指标
'''

from sklearn.metrics import explained_variance_score, mean_absolute_error, mean_squared_error, r2_score


def calPerformance(y_true,y_pred):
    '''
    模型效果指标评估
    y_true:真实的数据值
    y_pred:回归模型预测的数据值
    '''
    model_metrics_name=[explained_variance_score, mean_absolute_error, mean_squared_error, r2_score]
    tmp_list=[]
    for one in model_metrics_name:
        tmp_score=one(y_true,y_pred)
        tmp_list.append(tmp_score)
    print ['explained_variance_score','mean_absolute_error','mean_squared_error','r2_score']
    print tmp_list
    return tmp_list


def mape(y_true, y_pred):
    return np.mean(np.abs((y_pred - y_true) / y_true)) * 100
from sklearn.metrics import r2_score
RMSE = mean_squared_error(y_train_predict, y_train)**0.5
print('训练集上的/RMSE/MAE/MSE/MAPE/R^2')
print(RMSE)
print(mean_absolute_error(y_train_predict, y_train))
print(mean_squared_error(y_train_predict, y_train) )
print(mape(y_train_predict, y_train) )
print(r2_score(y_train_predict, y_train) )


RMSE2 = mean_squared_error(y_test_predict, y_test)**0.5
print('测试集上的/RMSE/MAE/MSE/MAPE/R^2')
print(RMSE2)
print(mean_absolute_error(y_test_predict, y_test))
print(mean_squared_error(y_test_predict, y_test))
print(mape(y_test_predict,  y_test))
print(r2_score(y_test_predict, y_test))
结果输出如下所示:
训练集上的/RMSE/MAE/MSE/MAPE/R^2
0.011460134959888058
0.00918032687965506
0.00013133469329884847
4.304916429848429
0.9907179432442654
测试集上的/RMSE/MAE/MSE/MAPE/R^2
0.08477191056357428
0.06885029105374023
0.007186276820598636
24.05688263657184
0.4264760739398442
关于回归建模相关的内容感兴趣的话可以参考我前面的文章:
《常用数据回归建模算法总结记录》
《sklearn实践之——计算回归模型的四大评价指标(explained_variance_score、mean_absolute_error、mean_squared_error、r2_score)》


