性能测试工具-WRK
性能测试工具-WRK使用
1.简介
wrk是一款针对http协议的基准测试工具,它能够在单机多核CPU的条件下,使用系统自带的高性能 I/O机制,如epoll,kqueue等,通过多线程和事件模式,对目标机器产生大量的负载。
2.优劣势
2.1优势:
- 轻量级性能测试工具;
- 安装简单(相对 Apache ab 来说);
- 学习曲线基本为零,几分钟就能学会咋用了;
- 基于系统自带的高性能 I/O 机制,如 epoll, kqueue, 利用异步的事件驱动框架,通过很少的线程就可以压出很大的并发量;
2.2劣势:
wrk 目前仅支持单机压测,后续也不太可能支持多机器对目标机压测,因为它本身的定位,并不是用来取代 JMeter, LoadRunner 等专业的测试工具,wrk 提供的功能,对我们后端开发人员来说,应付日常接口性能验证还是比较友好的。
3.wrk安装
CentOS / RedHat / Fedora的系统安装方法
sudo yum groupinstall 'Development Tools'
sudo yum install -y openssl-devel git
git clone https://github.com/wg/wrk.git wrk
cd wrk
make
# 将可执行文件移动到 /usr/local/bin 位置
sudo cp wrk /usr/local/bin
Ubuntu/Debian系统上的安装方法
依次执行如下命令:

sudo apt-get install build-essential libssl-dev git -y
git clone https://github.com/wg/wrk.git wrk
cd wrk
make
# 将可执行文件移动到 /usr/local/bin 位置
sudo cp wrk /usr/local/bin
使用方法: wrk <选项> <被测HTTP服务的URL>
Options:
-c, --connections 跟服务器建立并保持的TCP连接数量
-d, --duration 压测时间
-t, --threads 使用多少个线程进行压测
-s, --script        指定Lua脚本路径
-H, --header        为每一个HTTP请求添加HTTP头
    --latency          在压测结束后,打印延迟统计信息
    --timeout       超时时间
-v, --version          打印正在使用的wrk的详细版本信息
代表数字参数,支持国际单位 (1k, 1M, 1G)
代表时间参数,支持时间单位 (2s, 2m, 2h)
当看到如下提示信息说明安装成功
[root@standalone wrk-master]# wrk -v
wrk [epoll] Copyright © 2012 Will Glozer
Usage: wrk
Options:
-c, --connections Connections to keep open
-d, --duration Duration of test
-t, --threads Number of threads to use
-s, --script        Load Lua script file
-H, --header        Add header to request
    --latency          Print latency statistics
    --timeout       Socket/request timeout
-v, --version          Print version details
Numeric arguments may include a SI unit (1k, 1M, 1G)
Time arguments may include a time unit (2s, 2m, 2h)
[root@standalone wrk-master]#
## 4.wrk简单使

这里使用java构建一个简单的服务应用代码:

服务端程序接收参数,然后给出响应,响应是一个随机数。

```java
@RestController
@RequestMapping("/demo")
public class WrkServerTestFacade {

  private Random rand = new Random();

  @RequestMapping(
      value = "/get",
      method = {RequestMethod.GET})
  public int getData() {
    return rand.nextInt();
  }
}


@SpringBootApplication
public class WrkApplication {

  public static void main(String[] args) {
    SpringApplication.run(WrkApplication.class, args);
  }
}
这是一个简单版本的wrk服务测试。先启动java服务,进行一个简单的压力测试
[root@standalone ~]# wrk -t2 -c1000 -d10s --latency http://192.168.3.107:8080/demo/get
Running 10s test @ http://192.168.3.107:8080/demo/get
  2 threads and 1000 connections
  Thread Stats   Avg      Stdev     Max   +/- Stdev
    Latency    94.91ms   77.27ms   1.62s    87.84%
    Req/Sec     5.19k     2.00k   12.19k    71.02%
  Latency Distribution
     50%   75.09ms
     75%  110.86ms
     90%  175.86ms
     99%  351.70ms
  99264 requests in 10.05s, 14.02MB read
  Socket errors: connect 0, read 0, write 0, timeout 8
Requests/sec:   9873.74
Transfer/sec:      1.39MB
这条命令的意思是:使用10个线程、1000个连接、持续10秒,对 http://192.168.16.151:8080/demo/get这个地址进行压力测试。
压测报告说明
Running 10s test @ http://192.168.3.107:8080/demo/get
  2 threads and 1000 connections(使用2个线程和1000个连接)
  (线程数据)     (平均)    (标准差)  (最大值)   (正负一个标准差)
  Thread Stats   Avg      Stdev     Max   +/- Stdev
    延迟
    Latency    94.91ms   77.27ms   1.62s    87.84%
    请求/秒
    Req/Sec     5.19k     2.00k   12.19k    71.02%
  Latency Distribution
     50%   75.09ms(50% 的请求在75毫秒内)
     75%  110.86ms(75%的请求在110毫秒内)
     90%  175.86ms(90%的请求在172毫秒内)
     99%  351.70ms(99%的请求在351毫秒内)
  99264 requests in 10.05s, 14.02MB read
  Socket errors: connect 0, read 0, write 0, timeout 8 存在在8个超时的错误
Requests/sec:   9873.74 (QPS,平均每秒的请求数)
Transfer/sec:      1.39MB (每秒传输1.39MB的流量)
标准差,简单来说,标准差是一组数据平均值分散程度的一种度量。一个较大的标准差,代表大部分数值和其平均值之间差异较大;一个较小的标准差,代表这些数值较接近平均值。标准差如果太大说明样本本身离散程度比较高,有可能系统性能波动较大。
修改参数再来做一个测试
[root@standalone ~]# wrk -t2 -c128 -d10s --latency  http://192.168.3.107:8080/demo/get
Running 10s test @ http://192.168.3.107:8080/demo/get
  2 threads and 128 connections
  Thread Stats   Avg      Stdev     Max   +/- Stdev
    Latency     9.12ms    7.66ms 116.17ms   90.08%
    Req/Sec     5.24k     2.51k    9.93k    56.02%
  Latency Distribution
     50%    6.49ms
     75%   11.56ms
     90%   16.20ms
     99%   41.09ms
  103036 requests in 10.06s, 14.56MB read
Requests/sec:  10246.51
Transfer/sec:      1.45MB
[root@standalone ~]#
当连接数降低至128时。可以发现,平时的时延降低了很多。
128个连接时50%的时延在6.49ms,而1000的连接时延在75.09ms.降低了好几个量级。
这样可以发现每秒的请求数也有所提升。从1000个的9873,提升至10246个。
PS:关于线程数和连接数,差不是越大越好,大太将导致线程的上下文切换频繁,反而降低了性能,而太小又不足以发挥性能。这必然是一个针对机器压测后的一个实际数据。
一般的做法是区分,CPU密集型或者I/O密集型,
CPU密集型,最大不能超过CPU核心+1,再大将导致性能都浪费在上下文切换中,
I/O密集型,此配制可以CPU核数的2倍,或核心数数的4倍,因为I/O不需要过多的CPU参与,反正是等待回复,所以可以设置这么多的线程数,但如果超过一个极限,也将导致过多的上下文 切换,反而浪费了性能。
5.高级用法-携带动态参数。
再来个常用的带参数的请求。
@RestController
@RequestMapping("/demo")
public class WrkServerTestFacade {
  private Random rand = new Random();
  @RequestMapping(
      value = "/post",
      method = {RequestMethod.POST})
  public int getDataPost(@RequestBody PostData data) {
    System.out.println("data :" + data);
    return rand.nextInt();
  }
}

class PostData {
  private Integer data;
  private String name;
  public Integer getData() {
    return data;
  }
  public void setData(Integer data) {
    this.data = data;
  }
  public String getName() {
    return name;
  }
  public void setName(String name) {
    this.name = name;
  }
  @Override
  public String toString() {
    final StringBuilder sb = new StringBuilder("PostData{");
    sb.append("data=").append(data);
    sb.append(", name='").append(name).append('\'');
    sb.append('}');
    return sb.toString();
  }
}
先用其他工具测试下:
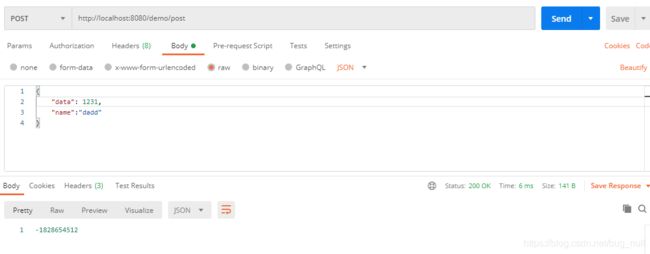
然后再来开始使用wrk进行参数的压测。
也同样先给出测试用的lua脚本
测试脚本1:
wrk.method="POST"
wrk.headers["Content-Type"]="application/json"
wrk.body= '{"data": 1111,"name" : "name"}'
一个固定的json字符串请求,使用post
[root@standalone lua]# wrk -t2 -c256 -d10s --latency -s post.lua   http://192.168.3.107:8080/demo/post
Running 10s test @ http://192.168.3.107:8080/demo/post
  2 threads and 256 connections
  Thread Stats   Avg      Stdev     Max   +/- Stdev
    Latency    16.08ms   11.96ms 142.69ms   81.92%
    Req/Sec     4.22k     1.85k    8.23k    63.64%
  Latency Distribution
     50%   12.53ms
     75%   21.55ms
     90%   30.76ms
     99%   60.80ms
  82841 requests in 10.09s, 11.71MB read
Requests/sec:   8211.46
Transfer/sec:      1.16MB
[root@standalone lua]#
测试脚本2
wrk.method="POST"
wrk.headers["Content-Type"]="application/json"
function request()
    user = '{"data":'..math.random(1,3000000)..',"name":"name"}'
    return wrk.format('POST',nil,nil,user)
end
通过脚本生成测试的相关的动态的json串发送
[root@standalone lua]# wrk -t2 -c256 -d10s --latency -s post2.lua   http://192.168.3.107:8080/demo/post
Running 10s test @ http://192.168.3.107:8080/demo/post
  2 threads and 256 connections
  Thread Stats   Avg      Stdev     Max   +/- Stdev
    Latency    18.72ms   13.57ms 126.21ms   84.49%
    Req/Sec     4.24k     2.06k    7.82k    54.95%
  Latency Distribution
     50%   14.46ms
     75%   23.14ms
     90%   35.22ms
     99%   70.27ms
  82668 requests in 10.06s, 11.68MB read
Requests/sec:   8213.75
Transfer/sec:      1.16MB
[root@standalone lua]#
6.wrk的lua脚本说明
wrk支持在三个阶段对进行个性化的设置,分别启动阶段、运行阶段、和结束阶段。每个运行线程都拥有独立的lua运行环境。
6.1 启动阶段
function setup(thread)
在脚本中实现setup方法,wrk就会在测试线程已经初始化、但还没有启动的时候调用。wrk会为每一个测试线程调用一次setup方法,并传入代表测试线程的对象thread作为参数,setup可操作thread对象,获取信息、存储信息、甚至关闭线程。
thread.addr - get or set the thread's server address
thread:name(name) - get the value of a global in the thread's env
thread:set(name,value) -set the value of a global in the thread env
thread:stop()  -  stop the thread
6.2 运行阶段
funcation init(args)
function delay()
function request()
function respone(status,headers,body)
init(args) 由测试线程调用,只会在进入运行阶段时调用一次,支持从启动的wrk的命令行中获取命令行参数。
delay() 在每次发送请求之前调用,如果需要定制延时时间可以在这个方法中设置。
request()用来生成请求,每一次请求都会调用该方法,注意不要在此方法做耗时操作。
respone(status,headers,body)每一次收到响应时被调用,为提升性能、如果没有定义该方法,wrk不会解析header和body;
6.3 结束阶段
function done(summary,latency,requests)
done()方法在整个测试过程中仅会被调用一次,可以从给定的参数中获取压测结果。生成定制化的压测报告。
6.4 自定义lua脚本可访问的变量
wrk变量
wrk={
	scheme = "http",
	host = "localhost",
	port = 8080,
	method = "GET",
	path = "/",
	headers = {},
	body = nil,
	thread = <userdata>
}
以上是wrk的全局变量,个性该wrk变量会影响所有的请求。
6.5 自定义脚本可使用方法
wrk.format
wrk.lookup
wrk.connect
#wrk format returns a HTTP request string containing the passed parameters merged with values from the wrk table.
#wrk format 返回一个http请求的字符串 包括传递的参数和全局参数wrk
function wrk.format(method,path,headers,body)


#wrk.lookup return a table containing all know address for the host and server pair. the correponds to the POSIX getaddress() #ftunction
# wrk.lookup 返回一个包含主机和所有已知地址的表。这对应于POSIX的getaddress方法
function wrk.lookup(host,service)

#wrk.connect returns true if the address can be connected to ,otherwise it return false, the address must be one returned from #wrk.lookup().
#测试服务是否可用,能连接返回true,否则返回false,这个地址必须是wrk.lookup返回的地址
function wrk.connect(addr)
7. 测试会话保持的压力测试
这是个常用的功能,先进行服务器的用户登录。再进行接口压力测试。
先看下服务端的程序。同样使用一个java的后台服务
@RestController
@RequestMapping("/demo")
public class WrkServerTestFacade {
  public static final String SESSION_ID = "SESSION_ID";

  /**
   * 执行登录操作
   *
   * @param data
   * @param request
   * @return
   */
  @RequestMapping(
      value = "/login",
      method = {RequestMethod.POST})
  public int login(@RequestBody PostData data, HttpServletRequest request) {
    PostData userDat = (PostData) request.getSession().getAttribute(SESSION_ID);
    if (userDat == null) {
      request.getSession().setAttribute(SESSION_ID, data);
    }
    return 1;
  }

  /**
   * 执行登录操作
   *
   * @param request
   * @return
   */
  @RequestMapping(
      value = "/getUser",
      method = {RequestMethod.GET})
  public String getUser(HttpServletRequest request) {
    PostData userDat = (PostData) request.getSession().getAttribute(SESSION_ID);
    if (null == userDat) {
      return "this is null";
    }

    return userDat.toString();
  }
}

class PostData {
  private Integer data;
  private String name;

  public Integer getData() {
    return data;
  }

  public void setData(Integer data) {
    this.data = data;
  }

  public String getName() {
    return name;
  }

  public void setName(String name) {
    this.name = name;
  }

  @Override
  public String toString() {
    final StringBuilder sb = new StringBuilder("PostData{");
    sb.append("data=").append(data);
    sb.append(", name='").append(name).append('\'');
    sb.append('}');
    return sb.toString();
  }
}

@SpringBootApplication
public class WrkApplication {

  public static void main(String[] args) {
    SpringApplication.run(WrkApplication.class, args);
  }
}
先使用工具测试接口:

再调用获取数据接口

工具测试通过。再来使用wrk进行下压力测试
先看测试脚本
-- 当前是否登录的标识
loginflag = false
path  = "http://192.168.3.107:8080/demo/login"
-- cookie的存储信息
sessionCookie = nil
-- 标识当前请求为json格式
wrk.headers["Content-Type"]="application/json"

-- 当前的请求方法
request = function()
		--未登录情况下,调用登录接口
        if loginflag == false then
                user = '{"data":'..math.random(1,3000000)..',"name":"name"}'
                return wrk.format('POST',path,nil,user)
		--已经登录则调有压力测试
        else
                return wrk.format('GET',path,nil,nil)
        end
end

-- 响应处理
response = function(status, headers, body)
   -- 首次检查
   if loginflag == false and status == 200 then
		-- 取出cookie
      sessionCookie = headers["Set-Cookie"]
	   -- 存储到header头中
      wrk.headers["Cookie"] = sessionCookie
	  -- 个性当前的路径
      path  = "http://192.168.3.107:8080/demo/getUser"
	  -- 标识当前已经登录
      loginflag = true
   end
end
执行压力测试
[root@standalone lua]# wrk -t1 -c4 -d10s --latency -s loginGet.lua   http://192.168.3.107:8080/
Running 10s test @ http://192.168.3.107:8080/
  1 threads and 4 connections
  Thread Stats   Avg      Stdev     Max   +/- Stdev
    Latency   497.88us  317.38us  11.69ms   96.91%
    Req/Sec     7.90k     1.10k    8.95k    95.00%
  Latency Distribution
     50%  445.00us
     75%  506.00us
     90%  592.00us
     99%    1.65ms
  78557 requests in 10.00s, 11.10MB read
Requests/sec:   7854.57
Transfer/sec:      1.11MB
[root@standalone lua]# wrk -t1 -c8 -d10s --latency -s loginGet.lua   http://192.168.3.107:8080/
Running 10s test @ http://192.168.3.107:8080/
  1 threads and 8 connections
  Thread Stats   Avg      Stdev     Max   +/- Stdev
    Latency   695.02us  325.27us  12.41ms   95.00%
    Req/Sec    10.18k     1.12k   11.13k    90.10%
  Latency Distribution
     50%  653.00us
     75%  741.00us
     90%    0.86ms
     99%    1.90ms
  102359 requests in 10.10s, 14.56MB read
Requests/sec:  10134.48
Transfer/sec:      1.44MB
[root@standalone lua]# wrk -t2 -c8 -d10s --latency -s loginGet.lua   http://192.168.3.107:8080/
Running 10s test @ http://192.168.3.107:8080/
  2 threads and 8 connections
  Thread Stats   Avg      Stdev     Max   +/- Stdev
    Latency   666.40us  224.39us  15.17ms   89.65%
    Req/Sec     5.41k   550.21     6.32k    49.01%
  Latency Distribution
     50%  625.00us
     75%  728.00us
     90%    0.86ms
     99%    1.37ms
  108752 requests in 10.10s, 15.47MB read
Requests/sec:  10767.26
Transfer/sec:      1.53MB
[root@standalone lua]#
8. 总结
本文中,我将我学习到的如何通过wrk这个工具进行http的压力测试的一些方法进行了总结,并详细讲解了在linux下安装wrk的方法,相关的lua函数说明,使用了3个案例,以及通过lua脚本来定制请求信息。希望读完本文对,你有所帮助。
9. 参考文档
- https://github.com/wg/wrk
- https://www.cnblogs.com/quanxiaoha/p/10661650.html
- https://www.iteye.com/blog/zjumty-2221040
- https://www.cnblogs.com/xinzhao/p/6233009.html
- https://www.runoob.com/lua/lua-tutorial.html