机器学习基础算法11-Logistic回归-ROC和AUC分类模型评估-实例
文章目录
-
- 一、模型评估介绍
-
- 1.分类模型评估
- 2.回归模型评估
- 二、ROC和AUC
-
- 1.理论知识
- 2. ROC曲线分析
- 3.TPR与FPR的计算过程
- 三、实例
-
- 1.实例1
- 2.实例2
- 3.实例3-鸢尾花数据集
一、模型评估介绍
1.分类模型评估
2.回归模型评估
二、ROC和AUC
1.理论知识
AUC概念理解: https://www.zhihu.com/question/39840928?from=profile_question_card
ROC全称是“受试者工作特征”(Receiver Operating Characteristic)。ROC曲线的面积就是AUC(Area Under the Curve)。AUC用于衡量“二分类问题”机器学习算法性能(泛化能力)。
ROC曲线是二值分类问题的一个评价指标。它是一个概率曲线,在不同的阈值下绘制TPR与FPR的关系图,从本质上把“信号”与“噪声”分开。
AUC越大表明当前分类算法分类效果越好

截断点(阈值)取不同的值,TPR和FPR的计算结果也不同。将截断点不同取值下对应的TPR和FPR结果画于二维坐标系中得到的曲线,就是ROC曲线。横轴用FPR表示。
2. ROC曲线分析

random chance这条直线是随机概率,一半的概率是对的,一半的概率是错的。如果低于这条线,说明算法极差,都不如随机猜的。因此在这条线的左边说明算法还好点。
3.TPR与FPR的计算过程
y = [0,0,1,1]
y_pre = [0.1,0.5,0.3,0.8]
阈值分别取:0.1,0.3,0.5,1
阈值为0.1时
y1=[1,1,1,1]
y2=[0,1,1,1]
y3 = [0,1,0,1]
y4 = [0,0,0,1]
三、实例
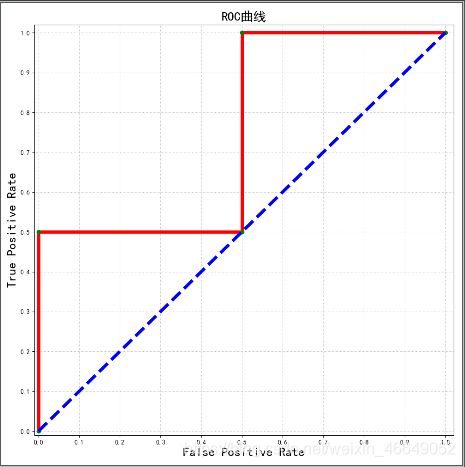
1.实例1
sklearn.metrics.roc_curve介绍: https://blog.csdn.net/sun91019718/article/details/101314545
# AUC举例-画出ROC曲线
import numpy as np
# 模型评估
from sklearn import metrics
import matplotlib as mpl
import matplotlib.pyplot as plt


if __name__ == '__main__':
    y = np.array([0, 0, 1, 1])
    y_pred = np.array([0.1, 0.5, 0.3, 0.8])

    # 返回三个数组结果分别是fpr(假正率),tpr(召回率),threshold(阈值)
    # 参数为真实结果数据、预测结果数据(可以是标签数据也可以是概率值)
    fpr,tpr,threshold = metrics.roc_curve(y,y_pred)
    # # np.insert将向量插入某一行或列
    # fpr = np.insert(fpr, 0, 0)
    # tpr = np.insert(tpr, 0, 0)
    print(fpr)
    print(tpr)
    print(threshold)
    # 计算AUC的值
    auc = metrics.auc(fpr, tpr)
    print(metrics.roc_auc_score(y, y_pred))

    # 解决matplotlib 中不能识别中文的问题
    mpl.rcParams['font.sans-serif'] = u'SimHei'
    mpl.rcParams['axes.unicode_minus'] = False

    plt.figure(figsize=(10,10), facecolor='w')
    # markerfacecolor =mfc linewidth=lw linestyle=ls  markeredgecolor = mec
    plt.plot(fpr, tpr, marker='o', lw=5, ls='-', mfc='g', mec='g', color='r')
    plt.plot([0, 1], [0, 1], lw=5, ls='--', c='b')

    # 调整坐标轴范围
    plt.xlim((-0.01, 1.02))
    plt.ylim((-0.01, 1.02))

    # 设置x轴、y轴的刻度
    plt.xticks(np.arange(0, 1.1, 0.1))
    plt.yticks(np.arange(0, 1.1, 0.1))

    # 设置行标签与列标签
    plt.xlabel('False Positive Rate', fontsize=20)
    plt.ylabel('True Positive Rate', fontsize=20)

    # 设置网格线
    plt.grid(b=True, ls='dotted')

    # 设置标题
    plt.title(u'ROC曲线', fontsize=20)
    plt.show()
[0.  0.  0.5 0.5 1. ]
[0.  0.5 0.5 1.  1. ]
[1.8 0.8 0.5 0.3 0.1]
0.75
2.实例2
import numpy as np
import pandas as pd
import matplotlib as mpl
import matplotlib.pyplot as plt
from sklearn.linear_model import LogisticRegression
from sklearn.preprocessing import label_binarize
from numpy import interp
from sklearn import metrics
from itertools import cycle


if __name__ == '__main__':

    np.random.seed(0)
    # 设置显示宽度
    pd.set_option('display.width', 300)
    # 全部打印,参数suppress表示是否用科学计数法表示浮点数
    np.set_printoptions(suppress=None)
    # 构造(300,50)的3个类别的数据
    n = 300
    x = np.random.randn(n, 50)
    y = np.array([0] * 100 + [1] * 100 + [2] * 100)
    print('y_before\n', y)
    n_class = 3


    # 若使用GridSearchCV网格搜索调参,要用到alpha
    ## 创建等比数列
    # alpha = np.logspace(-3, 3, 7)

    clf = LogisticRegression(penalty='l2', C=1)
    clf.fit(x, y)
    # decision_function相当于3个Logistic回归
    y_score = clf.decision_function(x)
    print('y_score = \n', y_score)
    '''对于n分类,会有n个分类器,然后,任意两个分类器都可以算出一个分类界面,这样,用decision_function()时,对于任意一个样例,就会有n*(n-1)/2个值。任意两个分类器可以算出一个分类界面,然后这个值就是距离分类界面的距离。
我想,这个函数是为了统计画图,对于二分类时最明显,用来统计每个点离超平面有多远,为了在空间中直观的表示数据以及画超平面还有间隔平面等。
decision_function_shape="ovr"时是4个值,为ovo时是6个值。'''

    # label_binarize将多类标签转化为二值标签,最终返回一个二值数组或稀疏矩阵;使用one-hot编码
    y = label_binarize(y, classes=np.arange(n_class))
    print('y_after\n', y)
    # cycle表示python的循环遍历;即循环遍历3个颜色
    colors = cycle('gbc')

    fpr = dict()
    tpr = dict()
    auc = np.empty(n_class + 2)
    # 解决字体问题
    mpl.rcParams['font.sans-serif'] = u'SimHei'
    mpl.rcParams['axes.unicode_minus'] = False

    plt.figure(figsize=(7, 6), facecolor='w')

    for i, color in zip(np.arange(n_class), colors):
        # print(i,color)
        # AUC曲线
        fpr[i], tpr[i], thresholds = metrics.roc_curve(y[:, i], y_score[:, i])
        auc[i] = metrics.auc(fpr[i], tpr[i])
        plt.plot(fpr[i], tpr[i], c=color, lw=1.5, alpha=0.7, label=u'AUC=%.3f' % auc[i])

    # micro,将三分类拉成一条线即数据放到一个数组中,变成二分类问题
    fpr['micro'], tpr['micro'], thresholds = metrics.roc_curve(y.ravel(), y_score.ravel())
    auc[n_class] = metrics.auc(fpr['micro'], tpr['micro'])
    plt.plot(fpr['micro'], tpr['micro'], c='r', lw=2, ls='-', alpha=0.8, label=u'micro,AUC=%.3f' % auc[n_class])

    # macro-平均值
    # np.concatenate((a,b,c,… ))能够一次完成多个数组的拼接
    # np.unique函数去除其中重复的元素,并按元素由大到小返回一个新的无元素重复的元组或者列表
    fpr['macro'] = np.unique(np.concatenate([fpr[i] for i in np.arange(n_class)]))
    # np.zeros_like(W)表示构造一个矩阵W_update,其维度与矩阵W一致,并为其初始化为全0;这个函数方便的构造了新矩阵,无需参数指定shape大小
    tpr_ = np.zeros_like(fpr['macro'])
    for i in np.arange(n_class):
        # numpy.interp()主要使用场景为一维线性插值,返回离散数据的一维分段线性插值结果。
        tpr_ += interp(fpr['macro'], fpr[i], tpr[i])
    tpr_ /= n_class
    tpr['macro'] = tpr_

    auc[n_class + 1] = metrics.auc(fpr['macro'], tpr['macro'])
    print(auc)
    print('Macro AUC:', metrics.roc_auc_score(y, y_score, average='macro'))
    plt.plot(fpr['macro'], tpr['macro'], c='m', lw=2, alpha=0.8, label=u'macro,AUC=%.3f' % auc[n_class + 1])
    plt.plot((0, 1), (0, 1), c='#808080', lw=1.5, ls='--', alpha=0.7)

    plt.xlim((-0.01, 1.02))
    plt.ylim((-0.01, 1.02))
    plt.xticks(np.arange(0, 1.1, 0.1))
    plt.yticks(np.arange(0, 1.1, 0.1))
    plt.xlabel('False Positive Rate', fontsize=13)
    plt.ylabel('True Positive Rate', fontsize=13)
    plt.grid(b=True)
    plt.legend(loc='lower right', fancybox=True, framealpha=0.8, fontsize=12)
    # plt.legend(loc='lower right', fancybox=True, framealpha=0.8, edgecolor='#303030', fontsize=12)
    plt.title(u'ROC和AUC', fontsize=17)
    plt.show()
y_before
 [0 0 0 0 0 0 0 0 0 0 0 0 0 0 0 0 0 0 0 0 0 0 0 0 0 0 0 0 0 0 0 0 0 0 0 0 0
 0 0 0 0 0 0 0 0 0 0 0 0 0 0 0 0 0 0 0 0 0 0 0 0 0 0 0 0 0 0 0 0 0 0 0 0 0
 0 0 0 0 0 0 0 0 0 0 0 0 0 0 0 0 0 0 0 0 0 0 0 0 0 0 1 1 1 1 1 1 1 1 1 1 1
 1 1 1 1 1 1 1 1 1 1 1 1 1 1 1 1 1 1 1 1 1 1 1 1 1 1 1 1 1 1 1 1 1 1 1 1 1
 1 1 1 1 1 1 1 1 1 1 1 1 1 1 1 1 1 1 1 1 1 1 1 1 1 1 1 1 1 1 1 1 1 1 1 1 1
 1 1 1 1 1 1 1 1 1 1 1 1 1 1 1 2 2 2 2 2 2 2 2 2 2 2 2 2 2 2 2 2 2 2 2 2 2
 2 2 2 2 2 2 2 2 2 2 2 2 2 2 2 2 2 2 2 2 2 2 2 2 2 2 2 2 2 2 2 2 2 2 2 2 2
 2 2 2 2 2 2 2 2 2 2 2 2 2 2 2 2 2 2 2 2 2 2 2 2 2 2 2 2 2 2 2 2 2 2 2 2 2
 2 2 2 2]
y_score =
 [[ 0.32685038 -0.89502432  0.56817394]
 [-0.0422872   0.67905325 -0.63676605]
 [ 0.47757658 -0.2195365  -0.25804007]
 [-0.42172474  1.74378664 -1.32206189]
 [ 0.65577849 -0.82875175  0.17297326]
 ...
 [ 0.67718684 -0.86463959  0.18745276]
 [-0.90389852  0.7618181   0.14208042]
 [ 0.18960878 -0.2339028   0.04429402]
 [ 0.2691091   1.11637781 -1.38548691]
 [ 0.86214186 -0.6845358  -0.17760606]
 [ 0.09309751  0.27959641 -0.37269392]]
after
 [[1 0 0]
 [1 0 0]
 ...
 [0 0 1]
 [0 0 1]
 [0 0 1]
 [0 0 1]
 [0 0 1]]
[0.7637     0.75355    0.7905     0.77014444 0.77269167]
Macro AUC: 0.7692500000000001
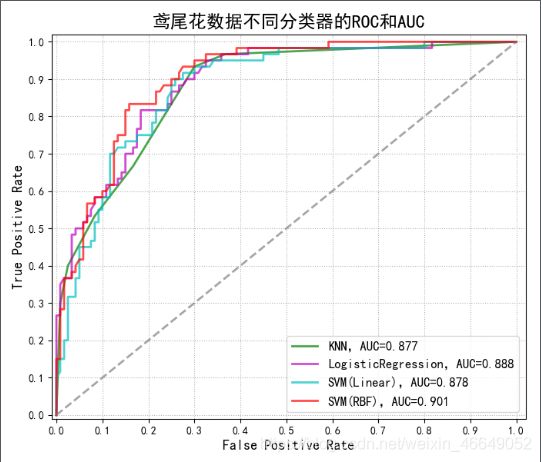
3.实例3-鸢尾花数据集
import numbers
import numpy as np
import scipy as sp
import pandas as pd
import matplotlib as mpl
import matplotlib.pyplot as plt
from sklearn.linear_model import LogisticRegression, LogisticRegressionCV
from sklearn.svm import SVC
from sklearn.neighbors import KNeighborsClassifier
from sklearn.model_selection import GridSearchCV
from sklearn.model_selection import train_test_split
from sklearn.preprocessing import label_binarize
from numpy import interp
from sklearn import metrics
from itertools import cycle


if __name__ == '__main__':

    np.random.seed(0)
    pd.set_option('display.width', 300)
    np.set_printoptions(suppress=True)
    data = pd.read_csv('iris.data', header=None)
    iris_types = data[4].unique()
    for i, iris_type in enumerate(iris_types):
        data.set_value(data[4] == iris_type, 4, i)
    x = data.iloc[:, :2]
    n, features = x.shape
    print(x)
    y = data.iloc[:, -1].astype(np.int)
    c_number = np.unique(y).size
    x, x_test, y, y_test = train_test_split(x, y, train_size=0.6, random_state=0)
    y_one_hot = label_binarize(y_test, classes=np.arange(c_number))
    alpha = np.logspace(-2, 2, 20)
    models = [
        ['KNN', KNeighborsClassifier(n_neighbors=7)],
        ['LogisticRegression', LogisticRegressionCV(Cs=alpha, penalty='l2', cv=3)],
        ['SVM(Linear)', GridSearchCV(SVC(kernel='linear', decision_function_shape='ovr'), param_grid={'C': alpha})],
        ['SVM(RBF)', GridSearchCV(SVC(kernel='rbf', decision_function_shape='ovr'), param_grid={'C': alpha, 'gamma': alpha})]]
    colors = cycle('gmcr')
    mpl.rcParams['font.sans-serif'] = u'SimHei'
    mpl.rcParams['axes.unicode_minus'] = False
    plt.figure(figsize=(7, 6), facecolor='w')
    for (name, model), color in zip(models, colors):
        model.fit(x, y)
        if hasattr(model, 'C_'):
            print(model.C_)
        if hasattr(model, 'best_params_'):
            print(model.best_params_)
        if hasattr(model, 'predict_proba'):
            y_score = model.predict_proba(x_test)
        else:
            y_score = model.decision_function(x_test)
        fpr, tpr, thresholds = metrics.roc_curve(y_one_hot.ravel(), y_score.ravel())
        auc = metrics.auc(fpr, tpr)
        print(auc)
        plt.plot(fpr, tpr, c=color, lw=2, alpha=0.7, label=u'%s,AUC=%.3f' % (name, auc))
    plt.plot((0, 1), (0, 1), c='#808080', lw=2, ls='--', alpha=0.7)
    plt.xlim((-0.01, 1.02))
    plt.ylim((-0.01, 1.02))
    plt.xticks(np.arange(0, 1.1, 0.1))
    plt.yticks(np.arange(0, 1.1, 0.1))
    plt.xlabel('False Positive Rate', fontsize=13)
    plt.ylabel('True Positive Rate', fontsize=13)
    plt.grid(b=True, ls=':')
    plt.legend(loc='lower right', fancybox=True, framealpha=0.8, fontsize=12)
    # plt.legend(loc='lower right', fancybox=True, framealpha=0.8, edgecolor='#303030', fontsize=12)
    plt.title(u'鸢尾花数据不同分类器的ROC和AUC', fontsize=17)
    plt.show()
       0    1
0    5.1  3.5
1    4.9  3.0
2    4.7  3.2
3    4.6  3.1
4    5.0  3.6
5    5.4  3.9
6    4.6  3.4
7    5.0  3.4
8    4.4  2.9
9    4.9  3.1
10   5.4  3.7
11   4.8  3.4
12   4.8  3.0
13   4.3  3.0
14   5.8  4.0
15   5.7  4.4
16   5.4  3.9
17   5.1  3.5
18   5.7  3.8
19   5.1  3.8
20   5.4  3.4
21   5.1  3.7
22   4.6  3.6
23   5.1  3.3
24   4.8  3.4
25   5.0  3.0
26   5.0  3.4
27   5.2  3.5
28   5.2  3.4
29   4.7  3.2
..   ...  ...
120  6.9  3.2
121  5.6  2.8
122  7.7  2.8
123  6.3  2.7
124  6.7  3.3
125  7.2  3.2
126  6.2  2.8
127  6.1  3.0
128  6.4  2.8
129  7.2  3.0
130  7.4  2.8
131  7.9  3.8
132  6.4  2.8
133  6.3  2.8
134  6.1  2.6
135  7.7  3.0
136  6.3  3.4
137  6.4  3.1
138  6.0  3.0
139  6.9  3.1
140  6.7  3.1
141  6.9  3.1
142  5.8  2.7
143  6.8  3.2
144  6.7  3.3
145  6.7  3.0
146  6.3  2.5
147  6.5  3.0
148  6.2  3.4
149  5.9  3.0

[150 rows x 2 columns]
0.8770833333333333
[0.18329807 0.18329807 0.18329807]
0.8884722222222222
{'C': 0.18329807108324356}
0.8777777777777778
{'C': 0.18329807108324356, 'gamma': 1.2742749857031335}
0.9009722222222222


