二进制部署Prometheus及监控服务并实现监控告警演示
二进制部署Prometheus及监控服务
一、部署prometheus
1、下载
版本:2.33.3
https://github.com/prometheus/prometheus/releases/download/v2.33.3/prometheus-2.33.3.linux-amd64.tar.gz
2、下载完后解压即可使用
[root@k8s-03 src]# tar -zxvf prometheus-2.33.3.linux-amd64.tar.gz
[root@k8s-03 src]# ls
prometheus-2.33.3.linux-amd64  prometheus-2.33.3.linux-amd64.tar.gz
[root@k8s-03 src]# mv prometheus-2.33.3.linux-amd64 /usr/local/prometheus
[root@k8s-03 src]# cd /usr/local/prometheus/
[root@k8s-03 prometheus]# ls
console_libraries  consoles  LICENSE  NOTICE  prometheus  prometheus.yml  promtool
[root@k8s-03 prometheus]# pwd
/usr/local/prometheus
3、设置prometheus开机启动
[root@k8s-03 prometheus]# cat /usr/lib/systemd/system/prometheus.service
[Unit]
Description=prometheus
[Service]
ExecStart=/usr/local/prometheus/prometheus --config.file=/usr/local/prometheus/prometheus.yml  --web.listen-address=:9091
ExecReload=/bin/kill -HUP $MAINPID
KillMode=process
Restart=on-failure
[Install]
WantedBy=multi-user.target
注:通过 启动脚本 加 --web.listen-address=:9091 参数的方式自定义prometheus端口,
以下演示。
[root@k8s-03 prometheus]# netstat -ntlp
Active Internet connections (only servers)
Proto Recv-Q Send-Q Local Address           Foreign Address         State       PID/Program name
tcp        0      0 127.0.0.1:25            0.0.0.0:*               LISTEN      1332/master
tcp        0      0 0.0.0.0:22              0.0.0.0:*               LISTEN      1069/sshd
tcp6       0      0 ::1:25                  :::*                    LISTEN      1332/master
tcp6       0      0 :::9091                 :::*                    LISTEN      2488/prometheus
tcp6       0      0 :::22                   :::*                    LISTEN      1069/sshd
[root@k8s-03 prometheus]# cat /usr/lib/systemd/system/pro
proc-sys-fs-binfmt_misc.automount  proc-sys-fs-binfmt_misc.mount      prometheus.service
[root@k8s-03 prometheus]# cat /usr/lib/systemd/system/pro
proc-sys-fs-binfmt_misc.automount  proc-sys-fs-binfmt_misc.mount      prometheus.service
[root@k8s-03 prometheus]# cat /usr/lib/systemd/system/prometheus.service
[Unit]
Description=prometheus
[Service]
ExecStart=/usr/local/prometheus/prometheus --config.file=/usr/local/prometheus/prometheus.yml  --web.listen-address=:9091
ExecReload=/bin/kill -HUP $MAINPID
KillMode=process
Restart=on-failure
[Install]
WantedBy=multi-user.target
网页访问:
4、设置开机自启
systemctl daemon-reload
systemctl start prometheus.service
systemctl enable prometheus.service  #开机启动
5、查看是否已启动
[root@k8s-03 prometheus]# netstat -ntlp
Active Internet connections (only servers)
Proto Recv-Q Send-Q Local Address           Foreign Address         State       PID/Program name
tcp        0      0 127.0.0.1:25            0.0.0.0:*               LISTEN      1332/master
tcp        0      0 0.0.0.0:22              0.0.0.0:*               LISTEN      1069/sshd
tcp6       0      0 ::1:25                  :::*                    LISTEN      1332/master
tcp6       0      0 :::9090                 :::*                    LISTEN      2302/prometheus
tcp6       0      0 :::22                   :::*                    LISTEN      1069/sshd
6、默认配置文件
[root@k8s-03 prometheus]# cat prometheus.yml
# my global config
global:
  scrape_interval: 15s # Set the scrape interval to every 15 seconds. Default is every 1 minute.
  evaluation_interval: 15s # Evaluate rules every 15 seconds. The default is every 1 minute.
  # scrape_timeout is set to the global default (10s).

# Alertmanager configuration
alerting:
  alertmanagers:
    - static_configs:
        - targets:
          # - alertmanager:9093

# Load rules once and periodically evaluate them according to the global 'evaluation_interval'.
rule_files:
  # - "first_rules.yml"
  # - "second_rules.yml"

# A scrape configuration containing exactly one endpoint to scrape:
# Here it's Prometheus itself.
scrape_configs:
  # The job name is added as a label `job=` to any timeseries scraped from this config.
  - job_name: "prometheus"

    # metrics_path defaults to '/metrics'
    # scheme defaults to 'http'.

    static_configs:
      - targets: ["localhost:9090"]
7、热加载prometheus配置文件
[root@prometheus prometheus]# ps -ef|grep prometheus
root 1081 1 0 13:25 ? 00:00:10 /opt/monitor/prometheus/prometheus --config.file=/opt/monitor/prometheus/prometheus.yml
root 3123 2619 0 14:10 pts/0 00:00:00 grep --color=auto prometheus
[root@prometheus prometheus]# kill -HUP 1081
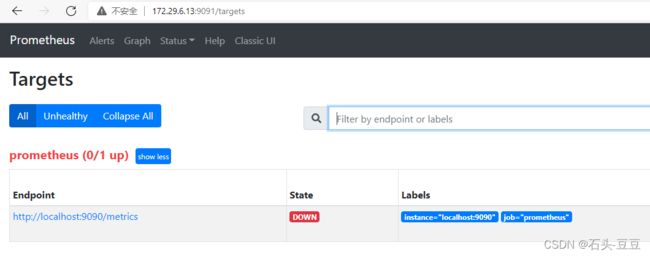
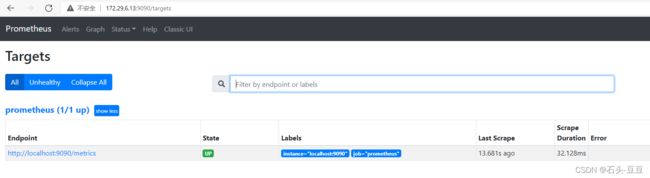
8、通过web验证prometheus是否启动
ip+9090端口
二、安装node-exporter
1、下载 node-exporter
wget https://github.com/prometheus/node_exporter/releases/download/v1.3.1/node_exporter-1.3.1.linux-amd64.tar.gz
2、解压缩
[root@k8s-03 src]# tar -zxvf node_exporter-1.3.1.linux-amd64.tar.gz -C /usr/local/
[root@k8s-03 src]# cd /usr/local/
[root@k8s-03 local]# ls
bin  etc  games  include  lib  lib64  libexec  node_exporter-1.3.1.linux-amd64  prometheus  sbin  share  src
[root@k8s-03 local]# mv node_exporter-1.3.1.linux-amd64/ node_exporter
3、启动node-exporter
[root@k8s-03 node_exporter]# cat /usr/lib/systemd/system/node_exporter.service
[Unit]
Description=node_exporter
[Service]
ExecStart=/usr/local/node_exporter/node_exporter  --collector.systemd --collector.systemd.unit-include=(docker|sshd|nginx).service
ExecReload=/bin/kill -HUP $MAINPID
KillMode=process
Restart=on-failure
[Install]
WantedBy=multi-user.target
4、加载配置并启动
systemctl daemon-reload
systemctl start node_exporter.service
systemctl enable node_exporter.service #设置开机启动
5、浏览器验证
ip地址+端口

6、prometheus设置抓取目标 node_exporter
加入以下三行
  - job_name: "node_exporter"
    static_configs:
      - targets: ["localhost:9100"]
prometheus.yml 完整文档
# my global config
global:
  scrape_interval: 15s # Set the scrape interval to every 15 seconds. Default is every 1 minute.
  evaluation_interval: 15s # Evaluate rules every 15 seconds. The default is every 1 minute.
  # scrape_timeout is set to the global default (10s).

# Alertmanager configuration
alerting:
  alertmanagers:
    - static_configs:
        - targets:
          # - alertmanager:9093

# Load rules once and periodically evaluate them according to the global 'evaluation_interval'.
rule_files:
  # - "first_rules.yml"
  # - "second_rules.yml"

# A scrape configuration containing exactly one endpoint to scrape:
# Here it's Prometheus itself.
scrape_configs:
  # The job name is added as a label `job=` to any timeseries scraped from this config.
  - job_name: "prometheus"

    # metrics_path defaults to '/metrics'
    # scheme defaults to 'http'.

    static_configs:
      - targets: ["localhost:9090"]
  - job_name: "node_exporter"
    static_configs:
      - targets: ["localhost:9100"]
热加载prometheus
[root@k8s-03 prometheus]# ps -ef|grep prometheus
root       2564      1  0 15:13 ?        00:00:08 /usr/local/prometheus/prometheus --config.file=/usr/local/prometheus/prometheus.yml --web.listen-address=:9090
root      12384   2215  0 15:59 pts/0    00:00:00 grep --color=auto prometheus
root@k8s-03 prometheus]# kill -HUP 2564
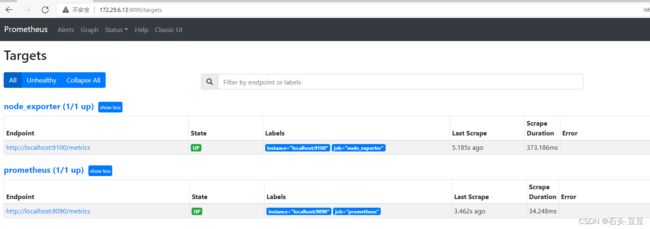
浏览器验证
三、部署alertmanager
1、下载alertmanager二进制包
[root@k8s-03 src]# wget https://github.com/prometheus/alertmanager/releases/download/v0.23.0/alertmanager-0.23.0.linux-amd64.tar.gz
2、解压二进制包
[root@k8s-03 src]# tar -zxvf alertmanager-0.23.0.linux-amd64.tar.gz -C /usr/local/
alertmanager-0.23.0.linux-amd64/
alertmanager-0.23.0.linux-amd64/alertmanager.yml
alertmanager-0.23.0.linux-amd64/LICENSE
alertmanager-0.23.0.linux-amd64/NOTICE
alertmanager-0.23.0.linux-amd64/alertmanager
alertmanager-0.23.0.linux-amd64/amtool
[root@k8s-03 src]# cd /usr/local/
[root@k8s-03 local]# ls
alertmanager-0.23.0.linux-amd64  bin  etc  games  include  lib  lib64  libexec  node_exporter  prometheus  sbin  share  src
[root@k8s-03 local]# mv alertmanager-0.23.0.linux-amd64/ alertmanager
[root@k8s-03 local]# ls
alertmanager  bin  etc  games  include  lib  lib64  libexec  node_exporter  prometheus  sbin  share  src
[root@k8s-03 local]# cd alertmanager/
[root@k8s-03 alertmanager]# ls
alertmanager  alertmanager.yml  amtool  LICENSE  NOTICE
[root@k8s-03 alertmanager]# pwd
/usr/local/alertmanager
3、添加systemd管理
[root@prometheus alertmanager]# cat /usr/lib/systemd/system/alertmanager.service
[Unit]
Description=alertmanager
[Service]
ExecStart=/usr/local/alertmanager/alertmanager --config.file=/usr/local/alertmanager/alertmanager.yml
ExecReload=/bin/kill -HUP $MAINPID
KillMode=process
Restart=on-failure
[Install]
WantedBy=multi-user.target
4、加载配置并启动 设置开机自启
systemctl daemon-reload
systemctl start alertmanager.service
systemctl enable alertmanager.service
5、检查alertmanager端口是否启动
root@k8s-03 alertmanager]# netstat -ntlp
Active Internet connections (only servers)
Proto Recv-Q Send-Q Local Address           Foreign Address         State       PID/Program name
tcp        0      0 127.0.0.1:25            0.0.0.0:*               LISTEN      1332/master
tcp        0      0 0.0.0.0:22              0.0.0.0:*               LISTEN      1069/sshd
tcp6       0      0 ::1:25                  :::*                    LISTEN      1332/master
tcp6       0      0 :::9090                 :::*                    LISTEN      2564/prometheus
tcp6       0      0 :::9093                 :::*                    LISTEN      12462/alertmanager
tcp6       0      0 :::9094                 :::*                    LISTEN      12462/alertmanager
tcp6       0      0 :::9100                 :::*                    LISTEN      12322/node_exporter
tcp6       0      0 :::22                   :::*                    LISTEN      1069/sshd
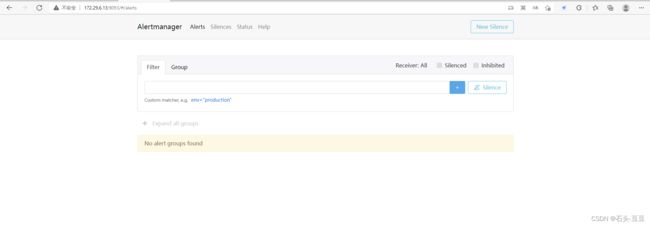
浏览器访问alertmanager 界面
ip+9093
6、修改prometheus 告警地址
修改 alertmanager 地址
# Alertmanager configuration
alerting:
  alertmanagers:
  - static_configs:
    - targets: ['localhost:9093']
prometheus 完整配置
[root@k8s-03 prometheus]# cat prometheus.yml
# my global config
global:
  scrape_interval: 15s # Set the scrape interval to every 15 seconds. Default is every 1 minute.
  evaluation_interval: 15s # Evaluate rules every 15 seconds. The default is every 1 minute.
  # scrape_timeout is set to the global default (10s).

# Alertmanager configuration
alerting:
  alertmanagers:
  - static_configs:
    - targets: ['localhost:9093']

# Load rules once and periodically evaluate them according to the global 'evaluation_interval'.
rule_files:
  # - "first_rules.yml"
  # - "second_rules.yml"

# A scrape configuration containing exactly one endpoint to scrape:
# Here it's Prometheus itself.
scrape_configs:
  # The job name is added as a label `job=` to any timeseries scraped from this config.
  - job_name: "prometheus"

    # metrics_path defaults to '/metrics'
    # scheme defaults to 'http'.

    static_configs:
      - targets: ["localhost:9090"]
  - job_name: "node_exporter"
    static_configs:
      - targets: ["localhost:9100"]
四、安装 钉钉告警
1、下载钉钉告警插件
[root@k8s-03 src]# wget https://github.com/timonwong/prometheus-webhook-dingtalk/releases/download/v2.0.0/prometheus-webhook-dingtalk-2.0.0.linux-amd64.tar.gz
2、解压压缩包
[root@k8s-03 src]# tar -zxvf prometheus-webhook-dingtalk-2.0.0.linux-amd64.tar.gz -C /usr/local/
[root@k8s-03 local]# mv prometheus-webhook-dingtalk-2.0.0.linux-amd64/ prometheus-webhook-dingtalk
3、设置钉钉告警模板
[root@k8s-03 templates]# pwd
/usr/local/prometheus-webhook-dingtalk/templates
[root@k8s-03 templates]# cat webhook.tmpl
{{- define "webhook.tmpl" }}
{{- range $i, $alert := .Alerts.Firing -}}
[报警项]:{{ index $alert.Labels "alertname" }}
[实例]:{{ index $alert.Labels "instance" }}
[job]:{{ index $alert.Labels "job" }}
[报警内容]:{{ index $alert.Annotations "summary" }}
[开始时间]:{{ $alert.StartsAt.Format "2006-01-02 15:04:05" }}
====================
{{- end }}
{{- end }}
4、修改钉钉机器人告警配置
我这里使用加签机器人 (建钉钉机器人可以勾选关键词、验签、IP地址)
templates:
  - templates/webhook.tmpl
## Targets, previously was known as "profiles"
targets:
  webhook1:     #加签的机器人
    url: https://oapi.dingtalk.com/robot/send?access_token=953d580a587dfb790df0bcfd70*******7d534c3a88
    # secret for signature
    secret: SEC6f8a6137e0c*******************221bac7009c52
  webhook2:     #不加签的机器人
    url: https://oapi.dingtalk.com/robot/send?access_token=xxxxxxxxxxxx
  webhook_legacy:
    url: https://oapi.dingtalk.com/robot/send?access_token=xxxxxxxxxxxx
    # Customize template content
    message:
      # Use legacy template
      title: '{{ template "legacy.title" . }}'
      text: '{{ template "legacy.content" . }}'
  webhook_mention_all:   #@所有人钉钉
    url: https://oapi.dingtalk.com/robot/send?access_token=xxxxxxxxxxxx
    mention:
      all: true
  webhook_mention_users:  #@指定用户钉钉
    url: https://oapi.dingtalk.com/robot/send?access_token=xxxxxxxxxxxx
    mention:
      mobiles: ['156xxxx8827', '189xxxx8325']
创建 webhook-dingtalk系统服务启动文件
vim /usr/lib/systemd/system/webhook-dingtalk.service
[Unit]
Description=prometheus-webhook-dingtalk
Documentation=https://github.com/timonwong/prometheus-webhook-dingtalk
After=network.target

[Service]
User=prometheus
Group=prometheus
ExecStart=/usr/local/prometheus-webhook-dingtalk/prometheus-webhook-dingtalk  --config.file=/usr/local/prometheus-webhook-dingtalk/config.yml
Restart=on-failure

[Install]
WantedBy=multi-user.target
启动服务报错:
Failed at step USER spawning /usr/local/prometheus-webhook-dingtalk/prometheus-webhook-dingtalk: No such process
解决办法:
命令的方式后台启动
nohup /usr/local/prometheus-webhook-dingtalk/prometheus-webhook-dingtalk --config.file=/usr/local/prometheus-webhook-dingtalk/config.yml &
5、curl测试发信到钉钉(复制下面第二第三项)
#先传统模式测试一下是否能收到消息
curl 'https://oapi.dingtalk.com/robot/send?access_token=0df42dc863ec08274b3f3226ca1fc6cd3a85564343' \
-H 'Content-Type: application/json' \
-d '{"msgtype": "text",
    "text": {
         "content": "shooter钉钉机器人群消息测试"
    }
  }'

#测试prometheus-webhook-dingtalk    (带验签 webhook1)
curl 'http://localhost:8060/dingtalk/webhook1/send' \
-H 'Content-Type: application/json' \
-d '{"msgtype": "text",
    "text": {
         "content": "shooter钉钉机器人群消息测试"
    }
  }'


curl 'http://localhost:8060/dingtalk/webhook1/send' \
   -H 'Content-Type: application/json' \
   -d '{"msgtype": "ding.link.text","text": {"ding.link.content": "'"咸鱼我来了"'"}}'
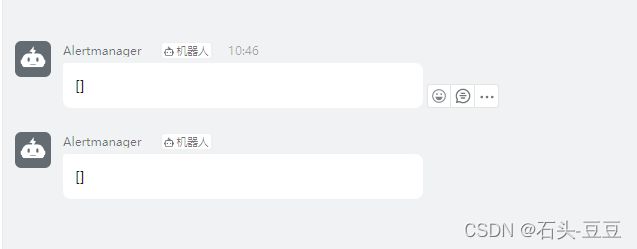
钉钉接收到消息说明成功了。(先不管消息为空的问题,这是因为接收参数问题)
五、修改alertmanager配置(钉钉告警版)
1、修改alertmanager.yml
global:
  resolve_timeout: 5m

#templates:
#  - '/opt/monitor/alertmanager/template/*.tmpl'

route:
  group_by: ['alertname']
  group_wait: 30s
  group_interval: 1m
  repeat_interval: 2m
  receiver: 'web.hook'
receivers:
- name: 'web.hook'
  webhook_configs:
  - url: 'http://localhost:8060/dingtalk/webhook1/send'
    send_resolved: true
inhibit_rules:
  - source_match:
      alertname: 'ApplicationDown'
      severity: 'critical'
    target_match:
      severity: 'warning'
    equal: ['alertname',"target","job","instance"]
2、重启alertmanager服务
systemctl restart alertmanager
六、设置prometheus告警规则
1、在 prometheus目录下新建rules文件夹,在文件夹下创建一个first_rules.yml规则文件
并设置告警规则 node节点不在线告警。
[root@k8s-03 rules]# pwd
/usr/local/prometheus/rules
[root@k8s-03 rules]# ls
first_rules.yml
[root@k8s-03 rules]# cat first_rules.yml
groups:
- name: 主机状态-监控告警
rules:
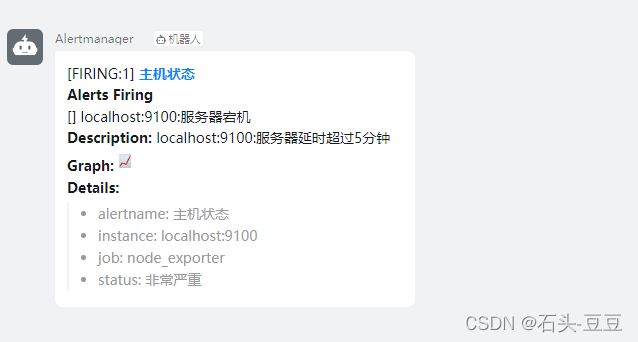
- alert: 主机状态
expr: up == 0
for: 1m
labels:
status: 非常严重
annotations:
summary: "{{$labels.instance}}:服务器宕机"
description: "{{$labels.instance}}:服务器延时超过5分钟"
2、修改prometheus设置告警规则文件路径
rule_files:
- “/usr/local/prometheus/rules/first_rules.yml”
去掉注释,并设置正确的规则文件路径。
# my global config
global:
  scrape_interval: 15s # Set the scrape interval to every 15 seconds. Default is every 1 minute.
  evaluation_interval: 15s # Evaluate rules every 15 seconds. The default is every 1 minute.
  # scrape_timeout is set to the global default (10s).

# Alertmanager configuration
# Alertmanager configuration
alerting:
  alertmanagers:
  - static_configs:
    - targets: ['localhost:9093']


# Load rules once and periodically evaluate them according to the global 'evaluation_interval'.
rule_files:
   - "/usr/local/prometheus/rules/first_rules.yml"
  # - "second_rules.yml"

# A scrape configuration containing exactly one endpoint to scrape:
# Here it's Prometheus itself.
scrape_configs:
  # The job name is added as a label `job=` to any timeseries scraped from this config.
  - job_name: "prometheus"

    # metrics_path defaults to '/metrics'
    # scheme defaults to 'http'.

    static_configs:
      - targets: ["localhost:9090"]
  - job_name: "node_exporter"
    static_configs:
      - targets: ["localhost:9100"]
3、热加载prometheus配置
ps -ef|grep prometheus
kill -HUP 2564
4、prometheus浏览器查看rules

5、关闭node_exporter服务看效果
systemctl stop node_exporter
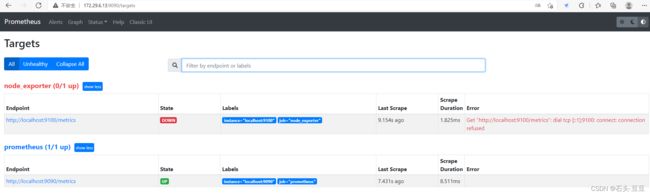
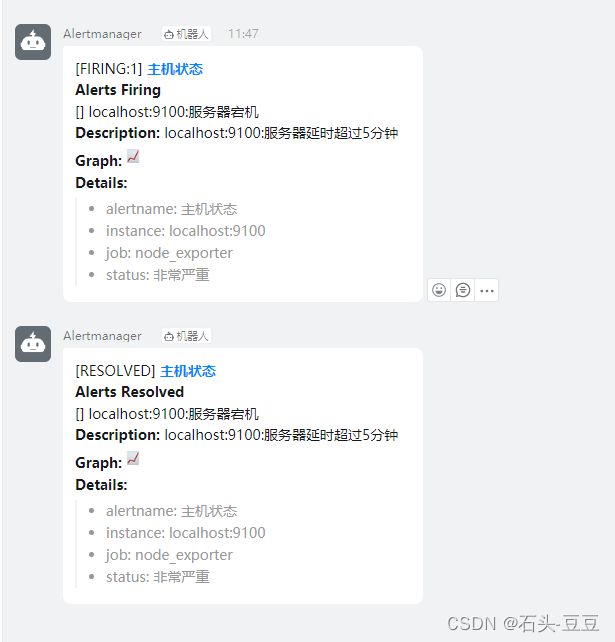
alertmanager 浏览器查看是否有告警!
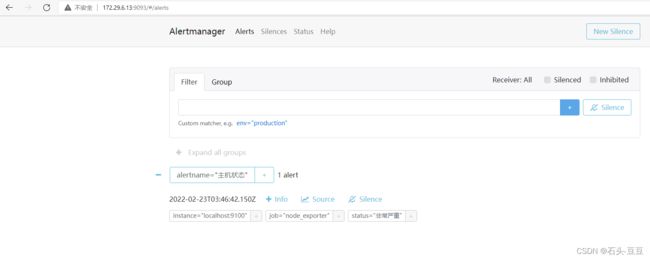
钉钉告警!
6、重启 node_exporter
[root@k8s-03 prometheus]# systemctl start node_exporter.service