js
import * as echarts from "echarts";
mounted() {
this.$nextTick(() => {
this.getBarEcharts() //柱状图
})
},
methods: {
// 柱状图
getBarEcharts() {
let barChart = echarts.init(document.getElementById("barChart"));
barChart.setOption({
tooltip: {
trigger: 'axis',
axisPointer: {
type: 'shadow',
}
},
legend: {
textStyle: {
color: "#fff", // 更改文本颜色
},
},
grid: {
left: '3%',
right: '4%',
bottom: '3%',
containLabel: true,
},
xAxis: {
type: 'value',
boundaryGap: [0, 0.01],
axisLabel: {
color: '#65C6E7'
},
// 不显示y轴刻度
axisTick: {
show: false
},
// 分割线颜色
splitLine: {
lineStyle: {
color: '#b4b6bc',
type: 'dashed' //虚线
}
},
// 不显示x轴的线
axisLine: {
show: false
},
},
yAxis: {
type: 'category',
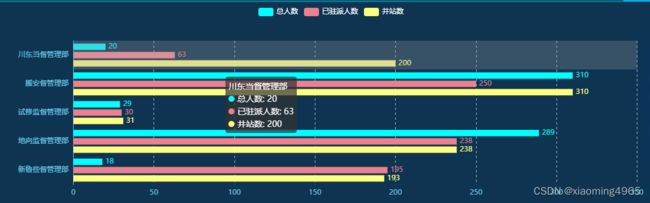
data: ['新鲁些督管理部', '地向监督管理部', '试修监督管理部', '搬安督管理部', '川东当督管理部'],
axisLine: {
//这是x轴文字颜色
lineStyle: {
color: "#65C6E7",
},
},
// 不显示y轴刻度
axisTick: {
show: false
},
},
series: [
{
name: '总人数',
type: 'bar',
itemStyle: {
normal: {
color: "#02ffff",
}
},
label: {
show: true,
position: 'right'
},
data: [18, 289, 29, 310, 20]
},
{
name: '已驻派人数',
type: 'bar',
itemStyle: {
normal: {
color: "#ec808d",
}
},
label: {
show: true,
position: 'right'
},
data: [195, 238, 30, 250, 63]
},
{
name: '井站数',
type: 'bar',
itemStyle: {
normal: {
color: "#ffff80",
}
},
label: {
show: true,
position: 'right'
},
data: [193, 238, 31, 310, 200]
}
]
})
window.addEventListener("resize", function () {
barChart.resize();
})
}
}
css
 .bar-chart {
      width: 60%;
      height: 100%;


      #barChart {
        width: 100%;
        height: 100%;
      }
    }