Matlab学习-绘图技巧(1)
**
Matlab绘图常用函数和参数设置
**
1. 去除图片白边
set(gca,'looseInset',[0 0 0 0]);
**
2. 画点、线设置形状、粗细、颜色
**
plot(x1,y1,'*-','linewidth',1,'color','r')
hold on;
scatter(x2,y2,'o','filled','b');
3.坐标轴范围设置
**
axis([0 500 -3 6]);
4.网格线
**
**
4.1 添加网格线
**
grid on;
4.2 设置网格线属性
**
grid on;
set(gca,'ygrid','on','gridlinestyle','--','Gridalpha',0.5,'GridColor','g','linewidth',2)
5. X、Y轴设置
**
**
5.1 X、Y轴标签
**
xlabel('时间 /s','FontWeight','bold','Fontsize',17);
ylabel('随机数','FontWeight','bold','Fontsize',17);
5.2 X、Y轴字体设置
**
set(gca,'Fontsize',20,'FontWeight','bold'); % 同时设置x、y轴标签和数字
5.3 X、Y轴刻度设置
5.3.1 设置坐标轴指定刻度
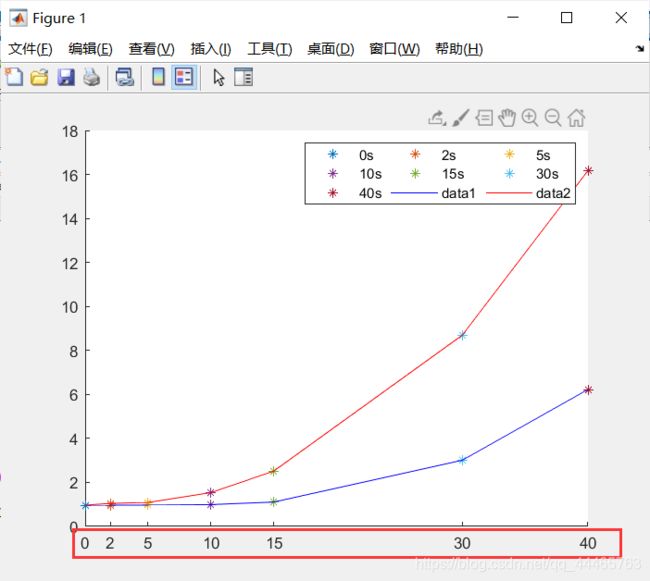
set(gca,'xtick',[0,2,5,10,15,30,40]);
5.3.2 设置坐标轴刻度值
set(gca,'xticklabel',{'0s','2s','5s','10s','15s','30s','40s'});
5.3.3 取消坐标轴科学计算法
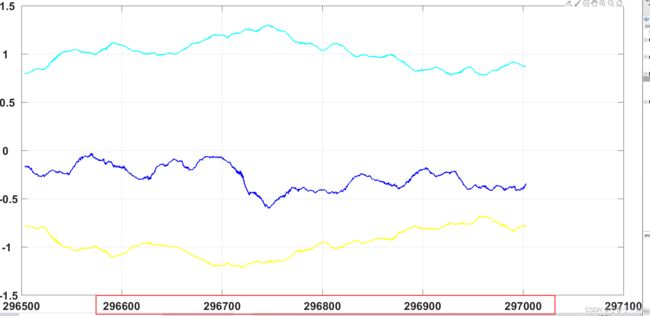
set(gca, 'xticklabel', get(gca, 'xtick'), 'yticklabel', get(gca, 'ytick'));
6. 图片标签
**
ps:title语句只能在画完图之后添加有效
title('图名','position',[150 4],'Fontsize',15,'FontWeight','bold','Color','k');
7. 图例
**
**
7.1 函数
**
ps:set(gca,…)也会设置图例中字体大小和粗细
legend({'legend-1','legend-1','legend-1','legend-1'});
**
7.2 设置图例中字体颜色和大小
**
legend({'legend-1','legend-1','legend-1','legend-1'},'Fontsize',10,'Textcolor','r');
lgd = legend('legend-1','legend-2','legend-3','legend-4');
lgd.FontSize = 20;
lgd.TextColor = 'r';
7.3 图例放置顺序
**
水平 or 垂直
lgd.Orientation = 'horizontal';   % 图例放置顺序
lgd.NumColumns = 2;               % 图例放置列数
7.4 给图例加标题
**
lgd = legend('legend-1','legend-2','legend-3','legend-4');
title(lgd,'legend title','Fontsize',15,'Color','g');
**
7.5 去除图例边框
**
lgd = legend('legend-1','legend-2','legend-3','legend-4');
lgd.NumColumns = 2;
legend boxoff;
**
8. 图片背景颜色修改
**
set(gcf,'color','r')   % 图形界面颜色设置
set(gca,'color','b')   % 绘图区域背景颜色


