vue、echarts 3D立体饼图鼠标悬浮显示信息 多版本echarts同时存在以及出现的bug解决

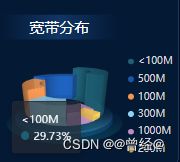
1、设计给出的图当中涉及到了3d立体饼图,项目当中我用的是echarts,当我在浏览器里面扩展基本实现样式了以后发现项目报错了,百度翻译了一下 大概率是echarts版本引起的,上扩展里面改了下项目当中的版本之后发现之前的水球图又版本不一致了(5.x可能是和4.x的不一样了)
2、定位到问题之后处理就是让两个版本的echarts同时存在即可
npm i echarts5@npm:[email protected]
npm install [email protected]
package.json
 "echarts": "^4.9.0",
 "echarts-gl": "^2.0.8",
 "echarts-liquidfill": "^2.0.6",
 "echarts5": "npm:echarts@^5.2.0",
.vue (用到5版本的时候单独引入一下echarts)
import * as echarts5 from 'echarts5'
还有一个问题就是虽然同时引入了echarts5 但是echarts-gl里面调用的还是4的版本,吧nodeMoudle下echarts-gl下面的文件里echarts 都改为echarts5(全改了别漏掉,暂时没想到好办法先这样处理着 有大佬想到方法,评论见)

3、实现设计图的样子基本就是echarts的3d勾勒出来的 底座是浮动上去添加一个现实的效果


底座背景图:

定义一个charts.js
/**
 * 绘制3d图
 * @param pieData 总数据
 * @param internalDiameterRatio:透明的空心占比
 * @param distance 视角到主体的距离
 * @param alpha 旋转角度
 * @param pieHeight 立体的高度
 * @param opacity 饼或者环的透明度
 */
const getPie3D = (pieData, internalDiameterRatio, distance, alpha, pieHeight, opacity = 1) => {
  const series = []
  let sumValue = 0
  let startValue = 0
  let endValue = 0
  let legendData = []
  let legendBfb = []
  const k = 1 - internalDiameterRatio
  pieData.sort((a, b) => {
    return b.value - a.value
  })
  // 为每一个饼图数据,生成一个 series-surface 配置
  for (let i = 0; i < pieData.length; i++) {
    sumValue += pieData[i].value
    const seriesItem = {
      name:
        typeof pieData[i].name === 'undefined'
          ? `series${i}`
          : pieData[i].name,
      type: 'surface',
      parametric: true,
      wireframe: {
        show: false
      },
      pieData: pieData[i],
      pieStatus: {
        selected: false,
        hovered: false,
        k: k
      },
      center: ['10%', '50%']
    }
    if (typeof pieData[i].itemStyle !== 'undefined') {
      const itemStyle = {}
      itemStyle.color =
        typeof pieData[i].itemStyle.color !== 'undefined'
          ? pieData[i].itemStyle.color
          : opacity
      itemStyle.opacity =
        typeof pieData[i].itemStyle.opacity !== 'undefined'
          ? pieData[i].itemStyle.opacity
          : opacity
      seriesItem.itemStyle = itemStyle
    }
    series.push(seriesItem)
  }

  // 使用上一次遍历时,计算出的数据和 sumValue,调用 getParametricEquation 函数,
  // 向每个 series-surface 传入不同的参数方程 series-surface.parametricEquation,也就是实现每一个扇形。
  legendData = []
  legendBfb = []
  for (let i = 0; i < series.length; i++) {
    endValue = startValue + series[i].pieData.value
    series[i].pieData.startRatio = startValue / sumValue
    series[i].pieData.endRatio = endValue / sumValue
    series[i].parametricEquation = getParametricEquation(
      series[i].pieData.startRatio,
      series[i].pieData.endRatio,
      false,
      false,
      k,
      series[i].pieData.value
    )
    startValue = endValue
    const bfb = fomatFloat(series[i].pieData.value / sumValue, 4)
    legendData.push({
      name: series[i].name,
      value: bfb
    })
    legendBfb.push({
      name: series[i].name,
      value: bfb
    })
  }
  const boxHeight = getHeight3D(series, pieHeight) // 通过pieHeight设定3d饼/环的高度,单位是px
  // 准备待返回的配置项,把准备好的 legendData、series 传入。
  const option = {
    backgroundColor: 'rgba(0,0,0,0)',
    legend: {
      show: false,
      icon: 'circle',
      itemHeight: 8,
      top: 'center',
      right: 0,
      orient: 'vertical',
      itemStyle: {
      },
      textStyle: {
        color: "#fff"
      }
    },
    labelLine: {
      show: true,
      lineStyle: {
        color: '#fff'
      }
    },
    label: {
      show: true,
      position: 'outside',
      formatter: '{b} {c} {d}% '
    },
    tooltip: {
      backgroundColor: 'rgba(36,42,50,.7)',
      borderColor: 'rgba(36,42,50,.7)',
      textStyle: {
        color: '#fff',
        fontSize: 13
      },
      formatter: params => {
        if (
          params.seriesName !== 'mouseoutSeries' &&
          params.seriesName !== 'pie2d'
        ) {
          const bfb = (
            (option.series[params.seriesIndex].pieData.endRatio -
              option.series[params.seriesIndex].pieData.startRatio) *
            100
          ).toFixed(2)
          return (
            `${params.seriesName}
` +
            `` +
            `${bfb}%`
          )
        }
      }
    },
    xAxis3D: {
      min: -1,
      max: 1
    },
    yAxis3D: {
      min: -1,
      max: 1
    },
    zAxis3D: {
      min: -1,
      max: 1
    },
    grid3D: {
      show: false,
      boxHeight: boxHeight, // 圆环的高度
      viewControl: {
        // 3d效果可以放大、旋转等,请自己去查看官方配置
        alpha, // 角度
        distance, // 调整视角到主体的距离,类似调整zoom
        rotateSensitivity: 0, // 设置为0无法旋转
        zoomSensitivity: 0, // 设置为0无法缩放
        panSensitivity: 0, // 设置为0无法平移
        autoRotate: false // 自动旋转
      }
    },
    series: series
  }
  console.log(option)
  return option
}

/**
 * 生成扇形的曲面参数方程,用于 series-surface.parametricEquation
 */
const getParametricEquation = (startRatio, endRatio, isSelected, isHovered, k, h) => {
  // 计算
  const midRatio = (startRatio + endRatio) / 2
  const startRadian = startRatio * Math.PI * 2
  const endRadian = endRatio * Math.PI * 2
  const midRadian = midRatio * Math.PI * 2
  // 如果只有一个扇形,则不实现选中效果。
  if (startRatio === 0 && endRatio === 1) {
    isSelected = false
  }
  // 通过扇形内径/外径的值,换算出辅助参数 k(默认值 1/3)
  k = typeof k !== 'undefined' ? k : 1 / 3
  // 计算选中效果分别在 x 轴、y 轴方向上的位移(未选中,则位移均为 0)
  const offsetX = isSelected ? Math.cos(midRadian) * 0.1 : 0
  const offsetY = isSelected ? Math.sin(midRadian) * 0.1 : 0
  // 计算高亮效果的放大比例(未高亮,则比例为 1)
  const hoverRate = isHovered ? 1.05 : 1
  // 返回曲面参数方程
  return {
    u: {
      min: -Math.PI,
      max: Math.PI * 3,
      step: Math.PI / 32
    },
    v: {
      min: 0,
      max: Math.PI * 2,
      step: Math.PI / 20
    },
    x: function (u, v) {
      if (u < startRadian) {
        return (
          offsetX +
          Math.cos(startRadian) * (1 + Math.cos(v) * k) * hoverRate
        )
      }
      if (u > endRadian) {
        return (
          offsetX + Math.cos(endRadian) * (1 + Math.cos(v) * k) * hoverRate
        )
      }
      return offsetX + Math.cos(u) * (1 + Math.cos(v) * k) * hoverRate
    },
    y: function (u, v) {
      if (u < startRadian) {
        return (
          offsetY +
          Math.sin(startRadian) * (1 + Math.cos(v) * k) * hoverRate
        )
      }
      if (u > endRadian) {
        return (
          offsetY + Math.sin(endRadian) * (1 + Math.cos(v) * k) * hoverRate
        )
      }
      return offsetY + Math.sin(u) * (1 + Math.cos(v) * k) * hoverRate
    },
    z: function (u, v) {
      if (u < -Math.PI * 0.5) {
        return Math.sin(u)
      }
      if (u > Math.PI * 2.5) {
        return Math.sin(u) * h * 0.1
      }
      return Math.sin(v) > 0 ? 1 * h * 0.1 : -1
    }
  }
}

/**
 * 获取3d丙图的最高扇区的高度
 */
const getHeight3D = (series, height) => {
  series.sort((a, b) => {
    return b.pieData.value - a.pieData.value
  })
  return (height * 25) / series[0].pieData.value
}

/**
 * 格式化浮点数
 */
const fomatFloat = (num, n) => {
  let f = parseFloat(num)
  if (isNaN(f)) {
    return false
  }
  f = Math.round(num * Math.pow(10, n)) / Math.pow(10, n) // n 幂
  let s = f.toString()
  let rs = s.indexOf('.')
  // 判定如果是整数,增加小数点再补0
  if (rs < 0) {
    rs = s.length
    s += '.'
  }
  while (s.length <= rs + n) {
    s += '0'
  }
  return s
}

export { getPie3D, getParametricEquation }
import { getPie3D } from '../pages/intelligentoperation/chart.js'
import * as echarts5 from 'echarts5'


    {{item.name}}


data(){
	return{
		kdColor: ['#1e5f73', '#f29551', '#f6c558', '#90d0f2', '#1b55a5', '#bd8cbf', '#093975', '#093975', '#093975', '#093975', '#093975'],
      optionDataSort: [],
      optionData: [
        {
          name: '<100M',
          value: 1276
        },
        {
          name: '100M',
          value: 888
        },
        {
          name: '200M',
          value: 176
        },
        {
          name: '300M',
          value: 588
        },
        {
          name: '500M',
          value: 976
        },
        {
          name: '1000M',
          value: 388
        }
      ],
      statusChart: null,
      option: {},
	}
}
created () {
    this.setLabel()
    this.loadPieData()//这个是为了模拟lengend   对原有数组排了下序  调接口后可以直接放在那  不用在这调用   我现在是静态数据
  },
  mounted () {
  this.initChart()
    //根据窗口变化自动调节图表大小
    const that = this
    window.onresize = function () {
      that.changeSize()
    }
  },
methoda(){
	loadPieData () {
      this.optionDataSort = this.optionData
      this.optionDataSort.sort((a, b) => {
        return b.value - a.value
      })
    },
    // 初始化label样式
    setLabel () {
      this.optionData.forEach((item, index) => {
        item.itemStyle = {
          color: this.kdColor[index]
        }
        item.backgroundColor = 'rgba(0,0,0,0)'
        item.grid = {
          left: 0,
          right: 0,
          bottom: 0,
          top: 0,
          containLabel: true,
        }
        item.label = {
          normal: {
            show: true,
            color: this.kdColor[index],
            formatter: [
              '{d}%'
            ].join(''), // 用来换行
            rich: {
              d: {
                color: this.kdColor[index],
                align: 'left'
              }
            }
          }
        }
        item.labelLine = {
          normal: {
            lineStyle: {
              width: 1,
              color: 'rgba(255,255,255,0.7)'
            }
          }
        }
      })
    },
    // 图表初始化
    initChart () {
      this.statusChart = echarts5.init(this.$refs.chart)
      // 传入数据生成 option, 构建3d饼状图, 参数工具文件已经备注的很详细
      this.option = getPie3D(this.optionData, 0.75, 220, 22, 45, 0.7)
      this.statusChart.setOption(this.option)
    },
    // 自适应宽高
    changeSize () {
      this.statusChart.resize()
    }
}
##############之前没去官网看对应的api以为水球图在echarts5.x版本api去掉了 不能用了,看完以后上面那些啰嗦的解决办法完全不需要了 只需要版本是echarts5.x 把水球图的版本升级到3.x就OK了,因为版本太高导致一些别的echarts图出不来 八成有对应的升级版本