主流前沿的开源监控和报警系统Prometheus+Grafana入门之旅-中
文章目录
- 监控基础
-
- 监控对运维重要性
- 监控理论基础
- 监控面临问题
- Prometheus部署
-
- 数据采集
-
- 概述
- exporter的使用
- pushgateway使用
-
- 部署
- 脚本测试
- 优缺点
- CPU使用率监控示例
- Grafana部署
-
- 定义
- 部署
- 配置数据源
- 创建测试Graph
监控基础
监控对运维重要性
- 运维是什么?
- 说白了就是管理服务器,保证服务器给线上产品提供稳定运行的服务环境。
- 监控是什么?
- 说白了就是用一种形式去盯着观察服务器把服务器的各种行为表现都显示出来用以发现问题和不足。
- 报警是什么?
- 监控和报警这两个词一定要分开说分开理解!监控是监控,报警是报警。监控是把行为表现展示出来,用来观察的。报警则是当监控获取的数据发生异常并且到达了某个临界点的时候,采用各种途径来通知用户通知管理员通知运维人员甚至通知老板。
- 很多时候总是把监控和报警混在一起说这是不正确的需要纠正,报警跟监控 严格来说 是需要分开对待的。
- 因为报警也有专门的报警系统。
- 报警系统包括⼏种主要的展现形式 : 短信报警,邮件报警,电话报警(语⾳播报), 通讯软件。
- 不像监控系统 ⽐较成型的报警系统 ⽬前⼤多数都是收费的 商业化。
- 报警系统中 最重要的⼀个概念之⼀ 就是对报警阈值的理解,阈值(Trigger Value) ,是监控系统中 对数据到达某⼀个临界值的定义;例如: 通过监控发现,当前某⼀台机器的CPU突然升⾼,到达了 99%的使⽤率,99 就是作为⼀次报警的 触发阈值。
监控理论基础
-
监控重要性
- 监控在企业中扮演着重要的监督者的⾓⾊,任何⼀个地⽅出现问题都需要及时的知道,很多情况下企业对某种类型的监控需要⾮常的敏感(采集的精度),例如⽤户正常访问这种业务级别的监控⼀旦出现了问题需要在秒级时间知道,(时间=钱)不然就是毁灭性的灾难和损失由其是针对哪些⼤规模的企业。
-
监控运维基础⼯作
- 基础运维(系列第⼀阶段)⼀线 主要扮演着 ⼀个处理⽇常任务,及时救⽕这样的⾓⾊。
- 监控的搭建 和 数据采集的⼯作 很多时候 需要依赖于 运维开发的协助(开发 创新),不管是哪⼀种运维(哪怕你是运维架构师 运维专家)在紧急的时候 ⼈⼈都要扮演起 救⽕英雄的⾓⾊⽽救⽕ 指的是 及时的发现和解决线上出现的各种故障 问题那么为了要做到 及时的发现问题,那么⼀个好的完善的监控系统 就很⾃然的作为运维⼯作中的第⼀优先任务。
-
监控系统设计
- 评估系统的业务流程 业务种类 架构体系,各个企业的产品不同,业务⽅向不同,程序代码不同,系统架构更不同,对于各个地⽅的细节 都需要有⼀定程度的认知 才可以开起设计的源头
- 分类出所需的监控项种类,⼀般可分为 : 业务级别监控 / 系统级别监控 / ⽹络监控 / 程序代码监控/ ⽇志监控 / ⽤户⾏为分析监控/ 其它种类监控⼤的分类 还有更多的细⼩分类。
-
监控系统实施总体过程
- 监控系统搭建
- 单点服务端的搭建(prometheus)
- 单点客户端的部署
- 单点客户端服务器测试
- 采集程序单点部署
- 采集程序批量部署
- 监控服务端HA / cloud
- 监控数据图形化搭建(Grafana)
- 报警系统测试(如Pagerduty)
- 报警规则测试
- 监控+报警联合测试
- 正式上线监控
- 数据采集编写
- shell / python / awk / lua (Nginx 安全控制,功能分类)/ php / perl/ go,作为监控数据采集, ⾸推 shell + python , 如果说 数据采集选取的模式 对性能/后台/界⾯ 不依赖, 那么shell速度最快 成本最低。
- ⼀次性采集和后台采集。
- 监控数据分析/算法
- 监控的数据分析和算法 其实⾮常依赖 运维架构师对Linux操作系统的各种底层知识的掌握
- 监控稳定测试
- 稳定性测试 就是通过⼀段时间的单点部署观察 对线上有没有任何影响
- 监控自动化
- 如监控客户端的批量部署,监控服务端的HA再安装,监控项⽬的修改,监控项⽬的监控集群变化的自动化, Puppet(配置⽂件部署),Jenkins(CI 持续集成部署) , CMDB(配置管理数据库)
- 监控图形化
- 采集的数据 和 准备好的监控算法,最终需要⼀个好的图形展⽰ 才能发挥最好的作⽤
- 监控系统搭建
监控面临问题
- 监控自动化依然不够
- 很少能和CMDB完善的结合起来
- 监控依然需要大量人工
- 监控的准确性和真实性 提⾼的缓慢
- 监控工具和方案的制定较为潦草
- 对监控本身的重视程度依然有待提高
Prometheus部署
数据采集
概述
Prometheus主要有两种方式采集:pull 主动拉取的形式和push 被动推送的形式。
pull : 指的是客户端(被监控机器)先安装各类已有exporters(由社区组织或企业开发的监控客户端插件)在系统上之后,exporters以守护进程的模式运行,并开始采集数据,exporter本身也是一个http_server可以对http请求作出响应返回数据,Prometheus用pull这种主动拉取的方式(HTTP get)去访问每个节点上exporter并采集回需要的数据。
push: 指的是在客户端(或服务端)安装官方提供的pushgateway插件,然后使用我们运维自行开发的各种脚本,把监控数据组织成K/V的形式metrics形式,发送给pushgateway之后pushgateway会在推送给Prometheus,这种是一种被动的数据采集模式。
exporter的使用
官网提供提供多种独立常用的exporter,这些exporter分别使用不同的开发语言开发
- prometheus
- alertmanager
- blackbox_exporter
- consul_exporter
- graphite_exporter
- haproxy_exporter
- memcached_exporter
- mysqld_exporter
- node_exporter
- pushgateway
- statsd_exporter
比如最常用的 node_exporter就非常强大,几乎可以把Linux系统中和系统自身相关的监控数据全抓出来(很多参数)
# 下载最新版本v1.4.0node_exporter
wget https://github.com/prometheus/node_exporter/releases/download/v1.4.0-rc.0/node_exporter-1.4.0-rc.0.linux-amd64.tar.gz
# 解压
tar -xvf node_exporter-1.4.0-rc.0.linux-amd64.tar.gz
# 进入目录
cd node_exporter-1.4.0-rc.0.linux-amd64
# 启动node_exporter
nohup ./node_exporter > node_exporter.log 2>&1 &
node_exporter默认工作在9100端口,可以响应Prometheus_server发过来的HTTP_GET请求,也可以响应其它方式的HTTP_GET请求,测试下请求
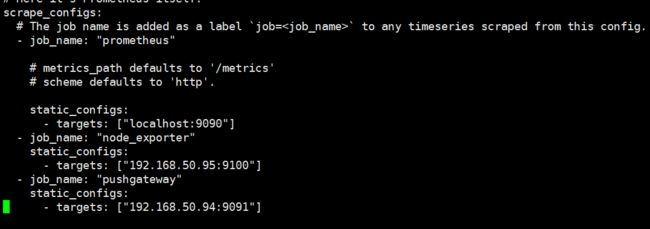
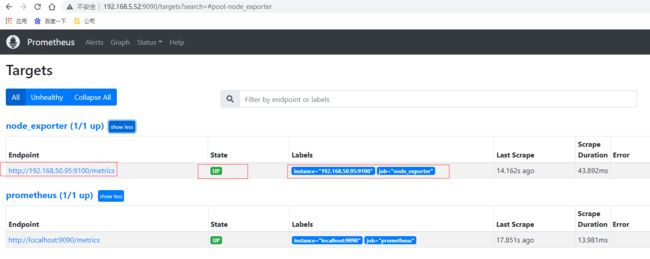
执行curl之后,可以看到node_exporter返回了大量的metrics类型的K/V数据,这些返回的K/V数据,其中的Key名称,可以直接复制到Prometheus的查询命令行来查看结果。将刚才node_exporter部署节点的通过文件配置发现的加入Prometheus的监控中,在Prometheus的prometheus.yml配置文件内scrape_configs配置节点中增加job_name: "node_exporter"的配置信息
scrape_configs:
  - job_name: "node_exporter"
    static_configs:
      # targets可以并行写入多个节点,用逗号隔开,机器名或者IP+端口号,端口号:通常用的就是exporter的端口,这里9100其实是node_exporter的默认端口
      - targets: ["192.168.50.95:9100"]
重新启动prometheus,prometheus就可以通过配置文件识别监控的节点,持续开始采集数据。查看监控目标页面已经有加进来的node_exporter节点了
# 先通过http请求查看刚部署的node_exporter节点的内存信息
curl localhost:9100/metrics | grep node_memory_MemFree
本⾝node_exporter提供的 keys 实在太多了 (因为 都是从Linux系统中的底层各种挖掘数据回来),找到key为node_memory_MemFree_bytes后直接复制在prometheus的Graph页面中查看,已经可以看到查询的数据
还可以切换到图查看最近15分钟的数据曲线趋势图
pushgateway使用
部署
pushgateway 是另⼀种采⽤被动推送的⽅式(⽽不是exporter主动获取)获取监控数据的prometheus 插件,它是可以单独运⾏在 任何节点上的插件(并不⼀定要在被监控客户端),然后通过⽤户⾃定义开发脚本把需要监控的数据发送给pushgateway,然后pushgateway再把数据推送给prometheus server。
pushgateway的安装以及运行和配置,pushgateway 跟 prometheus和 exporter ⼀样。
# 下载最新版本v1.4.0node_exporter
wget https://github.com/prometheus/pushgateway/releases/download/v1.4.3/pushgateway-1.4.3.linux-amd64.tar.gz
# 解压
tar -xvf pushgateway-1.4.3.linux-amd64.tar.gz
# 进入目录
cd pushgateway-1.4.3.linux-amd64/
# 启动pushgateway
nohup ./pushgateway > pushgateway.log 2>&1 &
从上面可以看到pushgateway默认的端口为9091,接下来 在prometheus.yml 配置⽂件中, 单独定义⼀个job配置target 指向到pushgateway运⾏所在的机器名和pushgateway运⾏的端口即可
  - job_name: "pushgateway"
    static_configs:
      # targets可以并行写入多个节点,用逗号隔开,机器名或者IP+端口号,端口号:通常用的就是pushgateway的端口,这里9091其实是pushgateway的默认端口
      - targets: ["192.168.50.94:9091"]
重新启动prometheus,查看监控目标页面已经有加进来的pushgateway节点了
脚本测试
pushgateway 本⾝是没有任何抓取监控数据的功能的 它只是被动的等待推送过来,pushgateway 编程脚本的写法,这里使⽤shell 编写的 pushgateway脚本⽤于抓取 TCP waiting_connection 瞬时数量,编写monitor.sh如下
#!/bin/bash
instance_name=`hostname -f | cut -d'.' -f1` #本机机器名变量于之后的 标签
if [ $instance_name == "localhost" ];then # 要求机器名不能是localhost不然标签就没有区分了
echo "Must FQDN hostname"
exit 1
fi

# For waitting connections
label="count_netstat_wait_connections" # 定义个新的 key
# 定义1个新的数值 netstat中 wait 的数量,通过Linux命令⾏ 就简单的获取到了需要监控的数据 TCP_WAIT数
count_netstat_wait_connections=`netstat -an | grep -i wait | wc -l`
echo "$label : $count_netstat_wait_connections"
# 把 key & value 推送给 pushgatway
echo "$label $count_netstat_wait_connections" | curl --data-binary
@- http://192.168.50.94:9091/metrics/job/pushgateway/instance/$instance_name
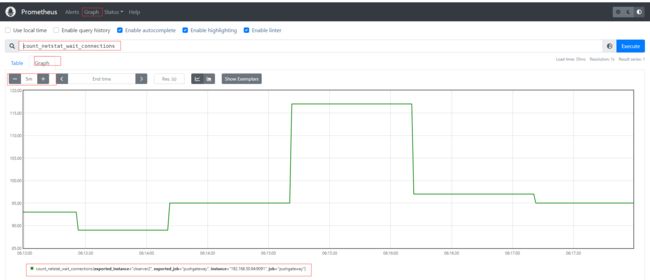
如果是每分钟推送一次则可以结合crontab,如* * * * * sh /home/commons/script/monitor.sh,如果是短于一分钟也可以shell脚本通过循环使用sleep实现;再到页面上查看刚才自定义的key,已经有采集到数据。
其他种类的监控数据我们都可以通过类似的形式直接写脚本发送实现自定义采集。
优缺点
pushgateway这种⾃定义的采集⽅式⾮常的快速⽽且极其灵活⼏乎不收到任何约束,⾮常希望 使⽤pushgateway来获取监控数据的,各类的exporters虽然玲琅满⽬⽽且默认提供的数据很多了已经,⼀般情况下企业中只安装 node_exporter 和 DB_exporter两个,其他种类的 监控数据倾向于全部使⽤pushgateway的⽅式采集 (要的就是快速~ 灵活~)。官网在最佳实践章节也有说明何时使用pushgateway,Pushgateway是一个中介服务,它允许你从无法抓取的工作中推送指标。
- pushgateway 会形成⼀个单点瓶颈,假如好多个脚本同时发送给 ⼀个pushgateway的进程如果这个进程没了,那么监控数据也就没了。
- pushgateway 并不能对发送过来的脚本采集数据进⾏更智能的判断,假如脚本中间采集出问题了那么有问题的数据pushgateway⼀样照单全收发送给Prometheus。
CPU使用率监控示例
# 通过node_cpu关键字查看关于cpu的监控项
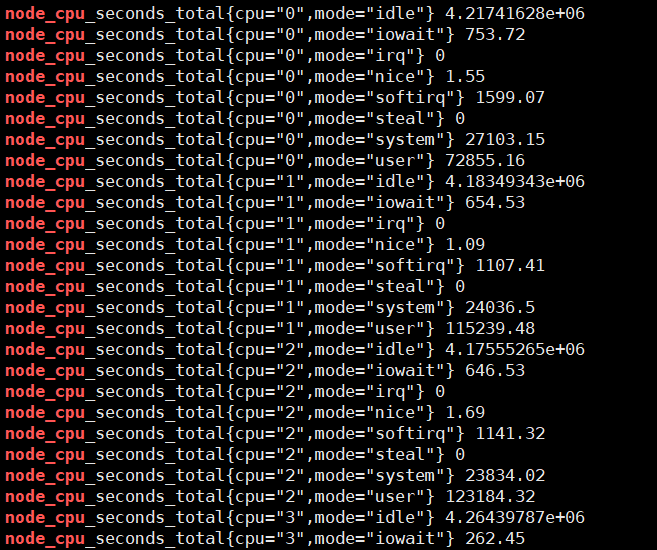
curl localhost:9100/metrics | grep node_cpu
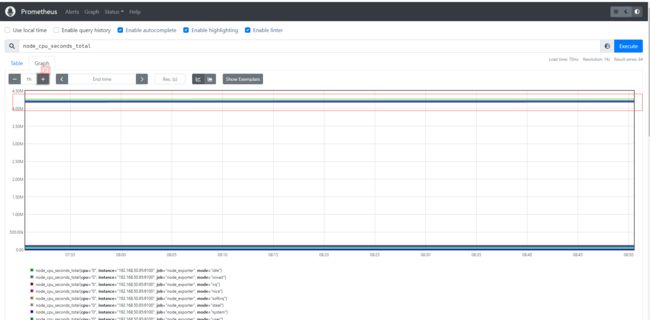
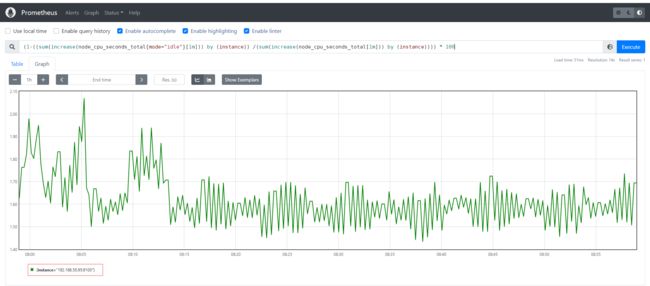
输入查询之后,可以看到结果,这个值是CPU各个核各个状态下从开机开始一直累积下来的CPU使用时间的累计值,但我们理解的CPU应该是使用率,类似百分50%和80%这样的数据才更好理解。
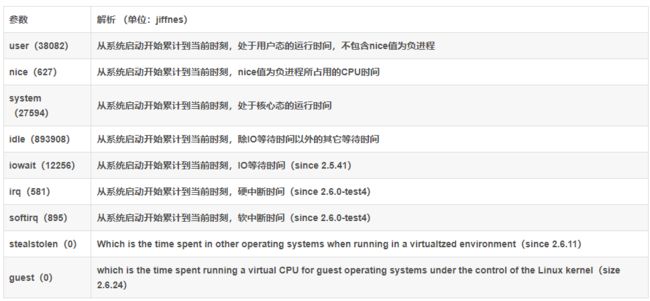
Prometheus对linux CPU的采集,并不是直接给我们返回一个现成的CPU百分比,而是返回Linux中很底层的cpu时间片,累积数值的咋样一个数据(我们平时用惯了top/uptime这种简便的方式看CPU使用率,根本没有深入理解所谓的CPU使用率在Linux中到底怎么回事),CPU使用时间包括CPU用户态使用时间,系统/内核态使用时间,nice值分配使用时间,空闲时间,中断时间等等。各个CPU状态的时间单位解如下:
# 编写数学公式如下,所以说需要理解底层原理和Prometheus对于数学的支持
(1-((sum(increase(node_cpu_seconds_total{mode="idle"}[1m])) by (instance)) /(sum(increase(node_cpu_seconds_total[1m])) by (instance)))) * 100
Grafana部署
定义
Grafana 官网地址 https://grafana.com/
Grafana 官网文档地址 https://grafana.com/docs/grafana/latest/?pg=oss-graf&plcmt=resources
Grafana GitHub地址 https://github.com/grafana/grafana
Grafana 是⼀款近⼏年新兴的开源数据绘图⼯具平台默认⽀持如下这么多种数据源作为输⼊,无论它们存储在哪里都可以查询、可视化、警告和理解您的指标,Grafana可以通过漂亮、灵活的仪表板创建、探索和共享所有的数据。最新版本为9.0.7,由于Grafana有告警功能,因此可以直接Grafana来替换prometheus自身提供的告警系统,这也是目前各大企业最青睐可视化产品和最佳实践。
部署
# 下载最新版本v9.0.7的grafana
wget https://dl.grafana.com/enterprise/release/grafana-enterprise-9.0.7.linux-amd64.tar.gz
# 解压文件
tar -xvf grafana-enterprise-9.0.7.linux-amd64.tar.gz
# 进入目录
cd grafana-9.0.7
# 后台运行grafana-server,可通过nohup &之类或后台运行管理工具如daemonize、screen
nohup ./grafana-server > grafana-server.log 2>&1 &
访问grafana默认端口3000,http://192.168.5.52:3000/ 输入用户名密码admin/admin ,下一步需要修改密码后进入主页面如下
配置数据源
选择左侧面板下面按钮,然后选择数据源,类型为prometheus,输入url即可
创建测试Graph
创建一个dashboards,编辑仪表盘,添加图,选择数据源,选择原始查询方式,填入前面自定义收集指标count_netstat_wait_connections,运行查询之后,选择最近5分钟的数据,简单图就出来了
**本人博客网站 **IT小神 www.itxiaoshen.com


