Python 竟然可以绘制3D图像!
Python,这门已经存在了很多年(以技术年度来计算)并且拥有几乎所有功能库的编程语言。想要发送电子邮件吗?Python可以帮助您。想要进行一些复杂的数学计算吗?Python也能胜任。日常我还会用它进行图像的绘制以及数据的可视化。但是大部分小伙伴应该没有使用过他的3D功能。所以,戴上您的3D眼镜(玩笑脸)!~
必备库
Matplotlib:它建立在NumPy数组坚实的基础上,旨在与 SciPy 堆栈协同工作。
Numpy:用于数组处理的首选包,提供高性能的多维数组和矩阵 python 进行数据处理的好伙伴。
mpl_toolkits:这是3D魔法发生的地方,它提供了基本的3D绘图工具。
示例1:3D中的正弦波舞蹈
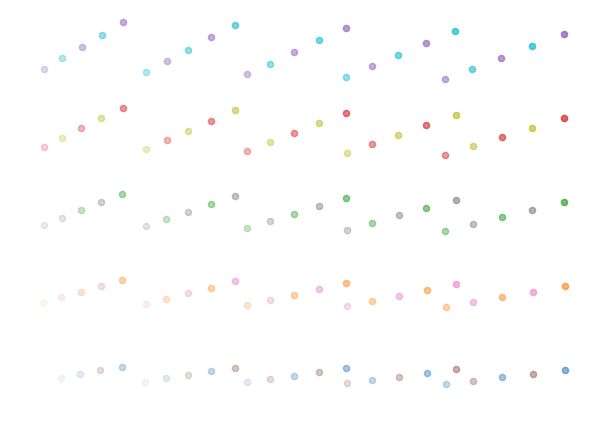
使用np.arange和np.sin,我们创建一个点的数组。然后,使用matplotlib的scatter()方法帮助我们绘制这个舞蹈。
# Import necessary libraries
import numpy as np
import matplotlib.pyplot as plt
from mpl_toolkits.mplot3d import Axes3D


# Set up the figure and axis
fig = plt.figure(figsize=(10, 10))
ax = plt.axes(projection='3d')


# Generating data points for the 3D sine wave
x = np.arange(0, 20, 0.1)
y = np.sin(x)
z = y * np.sin(x)
c = x + y


# Plotting the scatter graph
ax.scatter(x, y, z, c=c)


# Turning off the axis
plt.axis('off')


# Display the graph
plt.show()

运行结果展示
示例2:多彩的立方体
我们建立一个具有X=5、Y=5、Z=5维度的3D坐标轴,使用np.ones()来构建立方体的维度,然后使用alpha参数来控制颜色的透明度。
# Set up the figure and axis
fig = plt.figure(figsize=(10, 10))
ax = plt.axes(projection='3d')


# Data points for the cube
x = np.ones(5)
y = np.ones(5)
z = np.ones(5)


# Plotting the cube with different opacities
for i in range(5):
    for j in range(5):
        for k in range(5):
            ax.scatter(i, j, k, alpha=(i+j+k)/15)


# Turning off the axis
plt.axis('off')


# Display the graph
plt.show()
运行结果展示
示例3:绿色线框
使用numpy.linspace(),我们创建了一个线性放置的元素数组,然后可视化了一个3D线框。
# Set up the figure and axis
fig = plt.figure(figsize=(10, 10))
ax = plt.axes(projection='3d')


# Generating data points
x = np.linspace(-5, 5, 50)
y = np.linspace(-5, 5, 50)
x, y = np.meshgrid(x, y)
z = np.sin(np.sqrt(x**2 + y**2))


# Plotting the wireframe
ax.plot_wireframe(x, y, z, color='green')


# Turning off the axis
plt.axis('off')


# Display the graph
plt.show()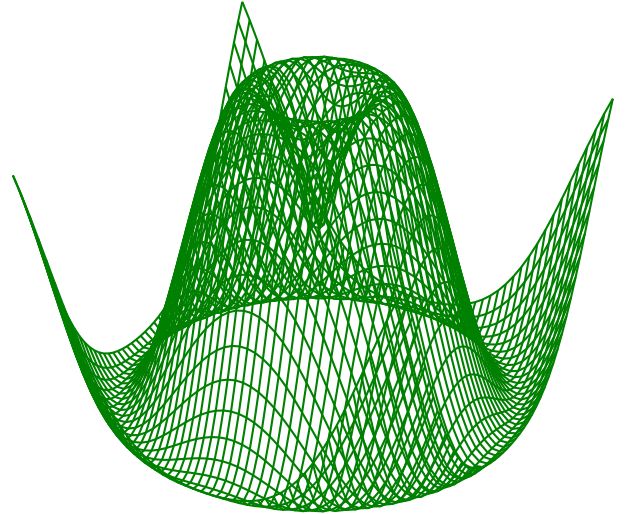

运行结果展示
示例4:360度螺旋
我们绘制了一个螺旋图形,并使用循环在360度旋转中查看它。
# Set up the figure and axis
fig = plt.figure(figsize=(10, 10))
ax = plt.axes(projection='3d')


# Generating the spiral data points
theta = np.linspace(-8 * np.pi, 8 * np.pi, 100)
z = np.linspace(-2, 2, 100)
r = z**2 + 1
x = r * np.sin(theta)
y = r * np.cos(theta)


# Plotting the spiral
ax.plot(x, y, z, 'b-')


# Turning off the axis
plt.axis('off')


# Display the graph
plt.show()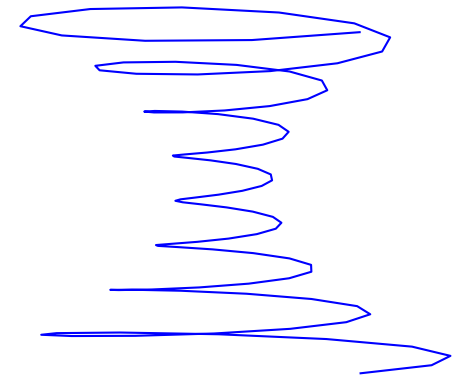
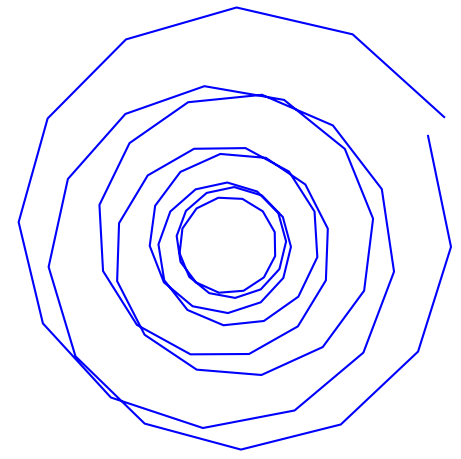
运行结果展示
尽管Python还不能为您冲杯咖啡(但愿意做到),但它确实可以让您的数据在3D中跳舞!
· END ·
HAPPY LIFE

本文仅供学习交流使用,如有侵权请联系作者删除