华为云云耀云服务器L实例评测|华为云上安装监控服务Prometheus三件套安装
文章目录
- 华为云云耀云服务器L实例评测|华为云上试用监控服务Prometheus
-
- 一、监控服务Prometheus三件套介绍
- 二、华为云主机准备
- 三、Prometheus安装
- 四、Grafana安装
- 五、alertmanager安装
- 六、三个服务的启停管理
-
- 1. Prometheus、Alertmanager 和 Grafana 启动顺序
- 2. 使用 supervisord 管理 Prometheus 生态组件
- 3. supervisord 配置示例demo:
华为云云耀云服务器L实例评测|华为云上试用监控服务Prometheus
一、监控服务Prometheus三件套介绍
Prometheus监控系统常见的组合方式是Prometheus + Alertmanager + Grafana,也就是所谓的Prometheus三件套。
- Prometheus:负责时间序列数据的收集、存储、查询、告警触发等功能,是监控系统的核心。
- Alertmanager:管理报警规则,对Prometheus发出的警报进行去除重复、分组、路由等处理,并发送报警通知,支持多种通知渠道。
- Grafana:一个数据可视化工具,可以查询Prometheus的数据源,并通过丰富的图表展示监控指标数据,构建dashboard。Grafana提供了强大的可视化功能。
Prometheus + Alertmanager + Grafana这种组合在监控系统中非常常见,
- 分工明确,每个组件专注做自己的事。Prometheus专注数据收集和查询,Alertmanager专注警报发送,Grafana专注可视化。
- 组件之间集成度高。Prometheus、Alertmanager和Grafana之间通过HTTP接口相连,无缝集成,很容易扩展。
Prometheus三件套是一个事实标准,组件协作性好,覆盖功能全,这也是它成为监控技术首选的重要原因。
二、华为云主机准备
- 购买华为云主机,本次评测系统如下:
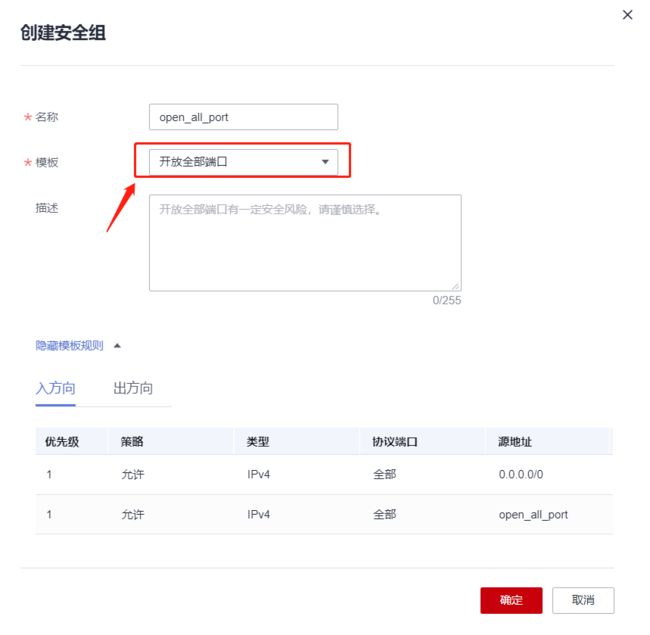
 2. 创建新的安全组,开发所有端口方便测试
 更改安全组,如下,选择我们的开发所有端口的这个安全组:
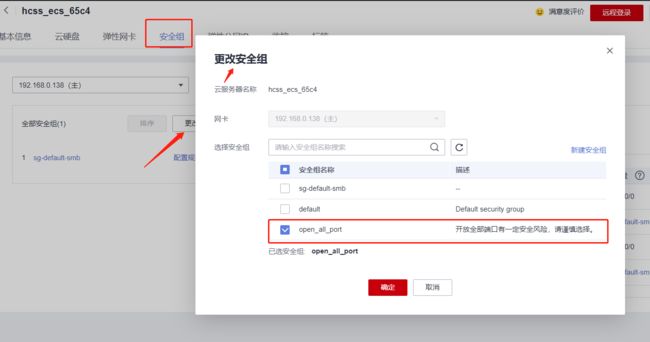
- 开发所有端口后,我们ssh登录上华为云主机即可~
三、Prometheus安装
官方下载:https://prometheus.io/download/
wget https://github.com/prometheus/prometheus/releases/download/v2.37.9/prometheus-2.37.9.linux-amd64.tar.gz
执行以下命令解压:
tar xvfz prometheus-*.tar.gz
cd prometheus-*
在启动Prometheus之前,让我们配置它。
配置 Prometheus 来监控自己
Prometheus 通过在目标节点的 HTTP 端口上采集 metrics(遥测专用词,度量指标)来监控目标节点(以下会称为“采样目标”)。因为 Prometheus 也以相同的方式暴露自己的数据,所以他也可以采集和检查自己的健康状况。
虽然在生产实践中 Prometheus 服务器只收集自己的数据没多大作用,但是这是个不错的入门示例。保存以下基础配置到文件 prometheus.yml 中:
global:
  scrape_interval:     15s # By default, scrape targets every 15 seconds.

  # Attach these labels to any time series or alerts when communicating with
  # external systems (federation, remote storage, Alertmanager).
  external_labels:
    monitor: 'codelab-monitor'

# A scrape configuration containing exactly one endpoint to scrape:
# Here it's Prometheus itself.
scrape_configs:
  # The job name is added as a label `job=` to any timeseries scraped from this config.
  - job_name: 'prometheus'

    # Override the global default and scrape targets from this job every 5 seconds.
    scrape_interval: 5s

    static_configs:
      - targets: ['localhost:9090']
完整配置选项说明,请查看配置文档(https://prometheus.io/docs/prometheus/latest/configuration/configuration/)
启动 Prometheus
# Start Prometheus.
# By default, Prometheus stores its database in ./data (flag --storage.tsdb.path).
./prometheus --config.file=prometheus.yml
此时 Prometheus 应该启动了。你应该也可以通过浏览器打开状态页面localhost:9090.
You can also verify that Prometheus is serving metrics about itself by navigating to its metrics endpoint: localhost:9090/metrics
这里给大家再给一个常用参数,-storage.tsdb.path 可以指定存储位置
示例demo:
/elkeid/prometheus/prometheus-2.31.1.linux-amd64/prometheus --config.file /elkeid/prometheus/prometheus.yml --storage.tsdb.path /elkeid/prometheus/
四、Grafana安装
参考官网说明,进行安装。
官网下线Grafana
Grafana提供强大的监控数据可视化功能。
wget https://dl.grafana.com/enterprise/release/grafana-enterprise-10.1.1.linux-amd64.tar.gz
tar -zxvf grafana-enterprise-10.1.1.linux-amd64.tar.gz
注意:第一次登录需要更改密码
http://127.0.0.1:3000/login
默认情况下,Grafana将在http://localhost:3000.上监听**。默认登录是"admin" / “admin”
五、alertmanager安装
官方下载地址:https://prometheus.io/download/
Alertmanager管理Prometheus生成的警报,支持语音、邮件、微信等多种警报通知方式。
Alertmanager是Prometheus监控系统中一个非常重要的组件。它负责处理监控数据发生异常时的告警信息,支持丰富的告警策略和告警通知方式。Alertmanager的配置可以非常灵活地满足不同场景的告警需求。
可以使用wget在github下载安装包
wget https://github.com/prometheus/alertmanager/releases/download/v0.26.0/alertmanager-0.26.0.linux-amd64.tar.gz
Alertmanager可以作为一个单独的进程运行,也可以和Prometheus一起部署。Alertmanager支持容器化部署方式,可以使用Docker等工具进行部署。部署Alertmanager需要将配置文件放置在特定的路径下,并启动Alertmanager进程。
Alertmanager默认监听9093端口,需要保证该端口在防火墙中开放。启动Alertmanager进程的命令如下:
./alertmanager --config.file=alertmanager.yml
六、三个服务的启停管理
1. Prometheus、Alertmanager 和 Grafana 启动顺序
Prometheus、Alertmanager 和 Grafana 这三个服务之间存在一定的启动顺序依赖关系:
- Prometheus 需要先启动,因为 Alertmanager 和 Grafana 都依赖 Prometheus 提供的数据源。
- Alertmanager 需要在 Prometheus 启动后再开始启动,因为它需要实时接收和处理 Prometheus 发送过来的警报。
- Grafana 最好在 Prometheus 和 Alertmanager 启动完成后再启动,因为它需要使用 Prometheus 提供的指标数据和 Alertmanager 提供的警报状态来展示监控信息。
推荐的启动顺序是:
- Prometheus
- Alertmanager
- Grafana
2. 使用 supervisord 管理 Prometheus 生态组件
使用 supervisord 管理 Prometheus 生态组件是一个常见的方案。
使用 supervisord 来管理 Prometheus、Alertmanager 和 Grafana 是一个不错的选择,也是很多人采用的方案。supervisord 是一个进程控制系统,可以很方便地管理和监控进程。使用它来管理这三个组件的主要好处有:
1. 可以统一管理,通过 supervisord 控制组件的启动、停止。
2. 支持进程自动重启,KEEPALIVE 机制让进程异常退出后能自动重启。
3. 可以通过 web UI 界面查看管理进程的运行状态、日志等信息。
4. 配置简单,supervisord 使用 INI 格式的配置文件,方便设置进程的运行参数。
5. 支持日志管理,可以将进程日志输出到 supervisord,方便统一查看。
6. 资源占用少,supervisord 自己轻量级,对系统影响很小。所以使用 supervisord 来管理 Prometheus 生态组件是一个稳定、高效的方案,也被许多用户采用,可以很好地简化组件的启停、监控和日志管理等工作。当然,也可以考虑使用 systemd 等其它进程管理工具。
3. supervisord 配置示例demo:
Prometheus、Alertmanager 和 Grafana 这三个服务
在 Supervisor 中可以通过以下方式来配置这个顺序:
- 把 Prometheus 放在配置文件的最前面
- 给 Prometheus 设置较高的 priority 值
这样可以确保 Prometheus 先启动,Alertmanager 在 Prometheus 可用后启动,Grafana 再在 Alertmanager 准备就绪后启动。
[program:prometheus]
command=/opt/lighthouse/server/env/prometheus/prometheus --config.file=/opt/lighthouse/server/env/prometheus/prometheus.yml
autorestart=true
autostart=true
user=www_lighthouse
priority=10
stdout_logfile=/opt/lighthouse/server/logs/supervisor/prometheus.log
stdout_logfile_maxbytes=50MB
stdout_logfile_backups=10

[program:alertmanager]
command=/opt/lighthouse/server/env/alertmanager/alertmanager --config.file=/opt/lighthouse/server/env/alertmanager/alertmanager.yml
autorestart=true
autostart=true
user=www_lighthouse
priority=5
stdout_logfile=/opt/lighthouse/server/logs/supervisor/alertmanager.log
stdout_logfile_maxbytes=50MB
stdout_logfile_backups=10

[program:grafana]
command=/opt/lighthouse/server/env/grafana/bin/grafana-server -config=/opt/lighthouse/server/env/grafana/conf/grafana.ini
autorestart=true
autostart=true
user=www_lighthouse
priority=1
# environment=HOME="/usr/share/grafana", USER="grafana"
stdout_logfile=/opt/lighthouse/server/logs/supervisor/grafana.log
stdout_logfile_maxbytes=50MB
stdout_logfile_backups=10