arcgis js 缓冲区分析(GP服务)
arcgis文档中的有提供缓冲区的接口 geometryService,但要4.19后版本才提供
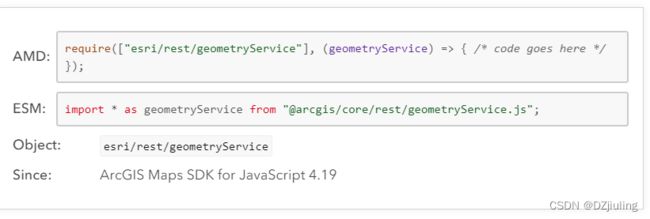
案例中使用的版本为4.16,因此这里的缓冲区分析借助gp工具
新建服务
1、打开arcmap
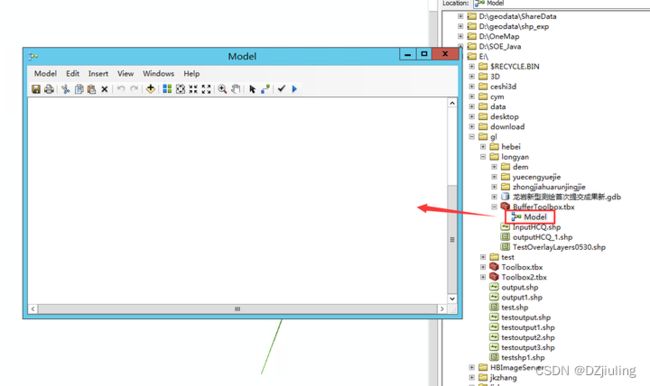
选择工具将要存放的文件夹,右键=> new => Toolbox
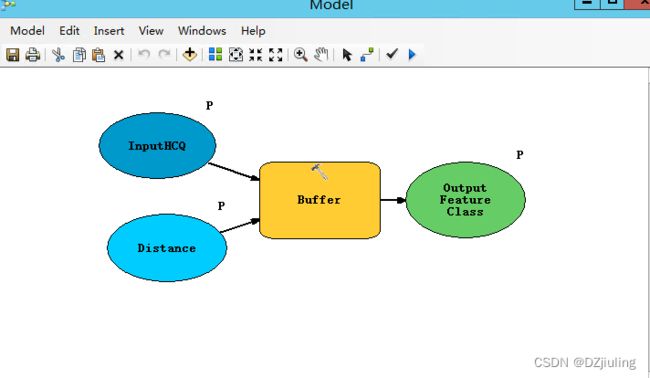
对新建好的工具的model(右键工具 new => model)进行编辑,如图
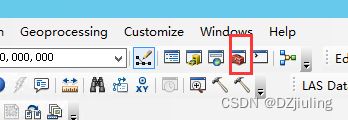
2、打开ArcToolbox
通过工具按钮打开ArcToolbox
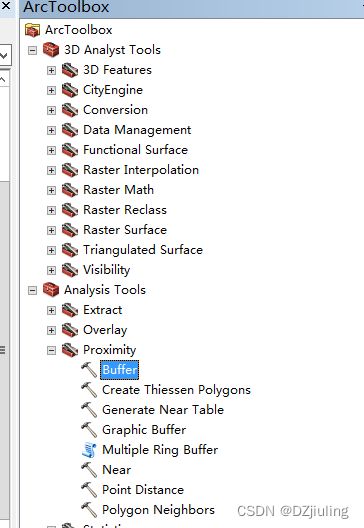
Buffer所在位置,如图
3、编辑服务工具
将Buffer工具拉入工具编辑界面,如图
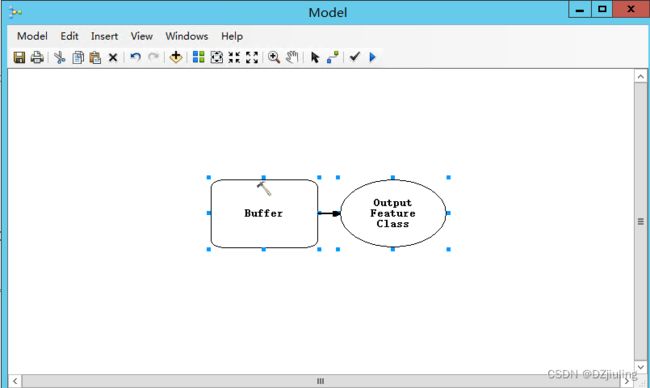
其中矩形为工具,椭圆为参数,参数可以是传参也可以是固定参数。
4、设置参数
右键矩形框 =>make Variable =>选择参数 可以选择所需要的传参,如图
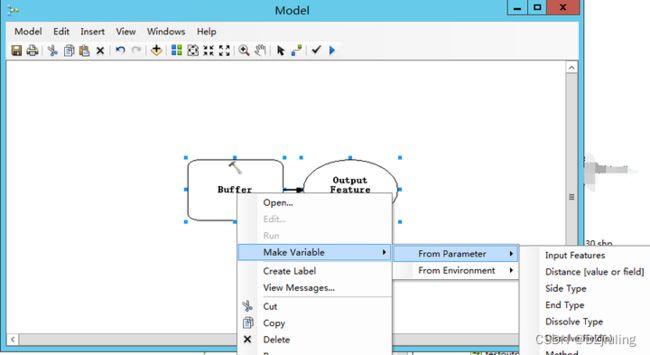
缓冲区分析需要的参数有 Input Features和Distance
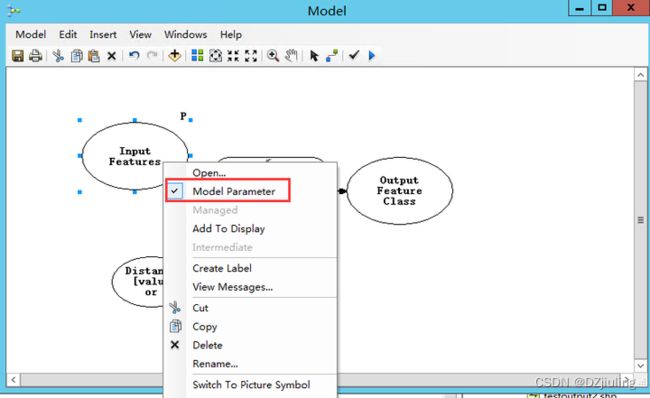
右键,选择Model Parameter将其设置参数,以Input Features为例,Distance同理,出现P即为需要传参,如图
5、设置需要传参的参数的数据
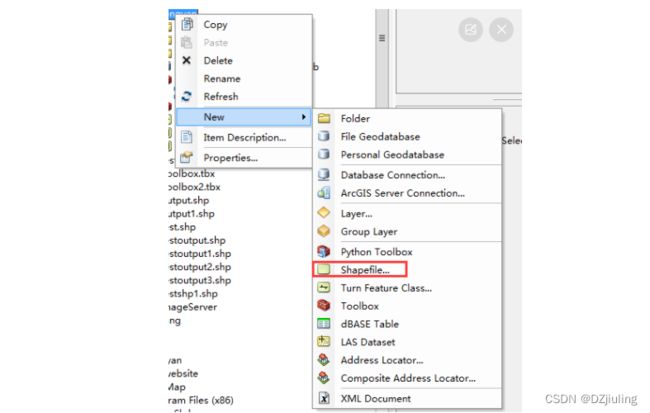
选择数据将要存放的文件夹,右键,选择Shapefile,如图
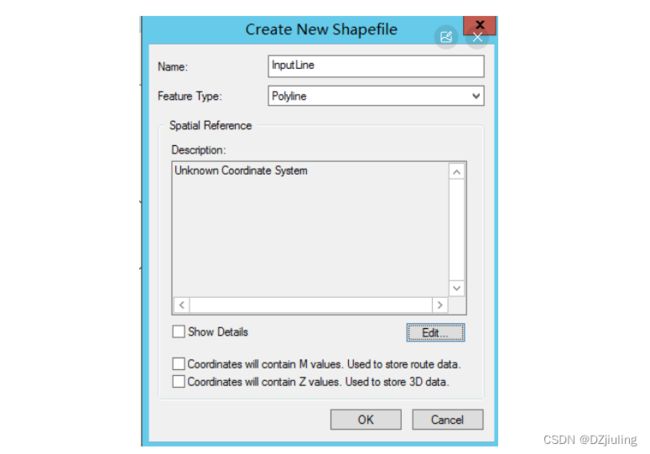
以线条为例,将Feature Type设置为Polyline
选择新建的shp数据,即InputLine进行编辑,选择Editor => Start Editing,如图

Start Editing后选择InputLine,选择工具栏的Create Features,如图

出现绘制工具,选择line,即可进行绘制(绘制通过双击结束)
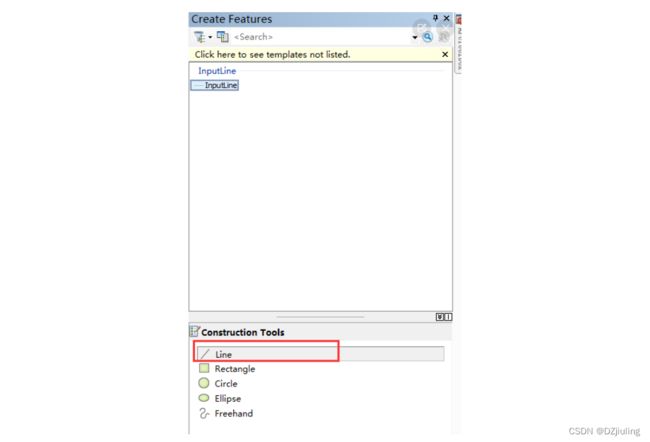
选择Editor => Save Editing 对绘制的shp进行保存
最后,双击椭圆形框(InputLine),选择保存好的shp文件,无色椭圆形框变为蓝色,如图
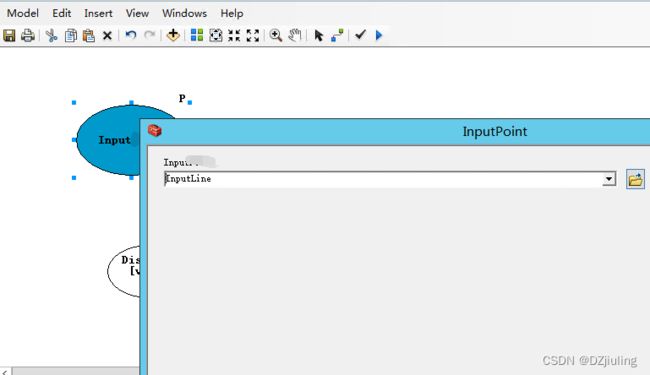
6、运行工具
双击新建的工具model运行,选择输出文件(重新创建不存在的name),如图
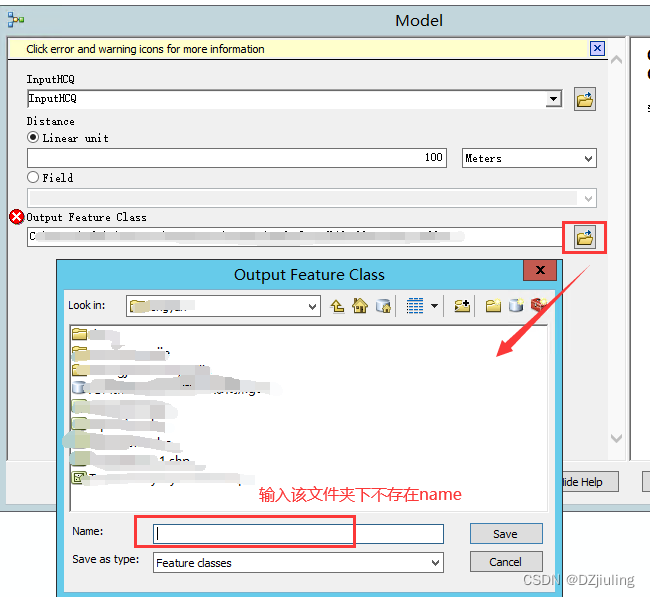
没有错误提示,选择OK,如图
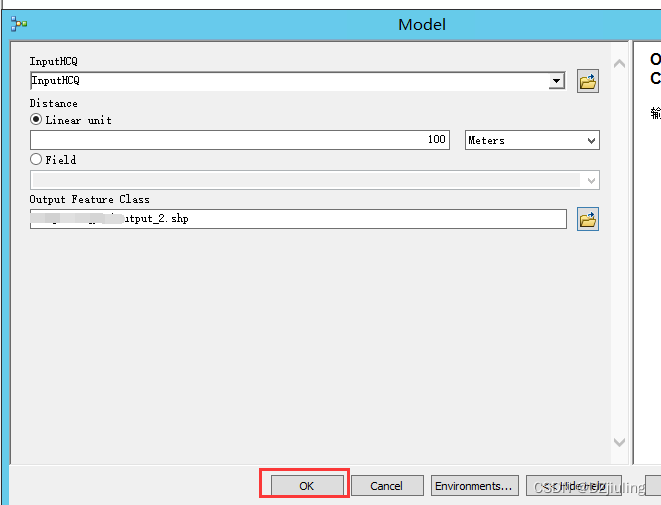
发布服务
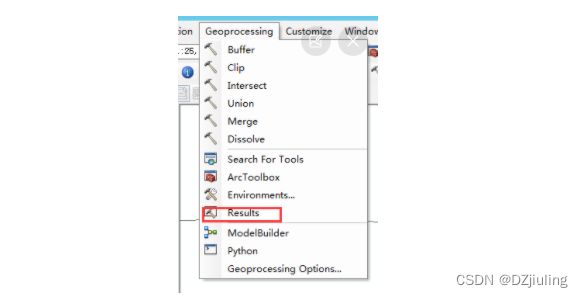
1、Geoprocessing => results =>选中工具下的model,如图
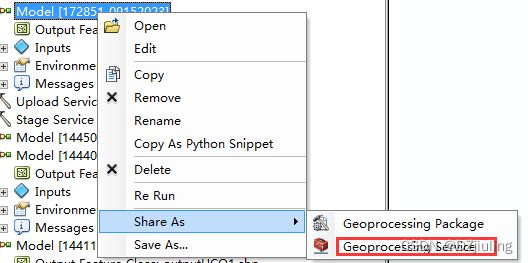
2、根据Output Feature即输出结果的shp选择对应的model进行发布,如图

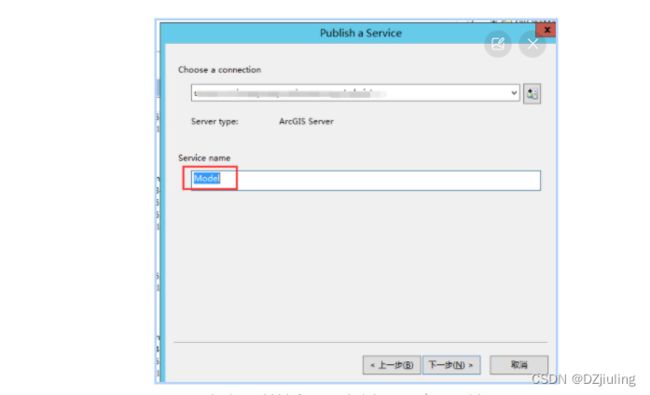
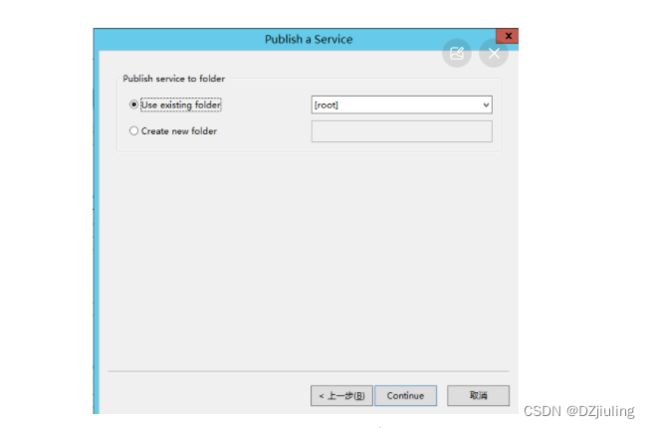
右键model => share as => Geoprocessing service,如图,点击下一步
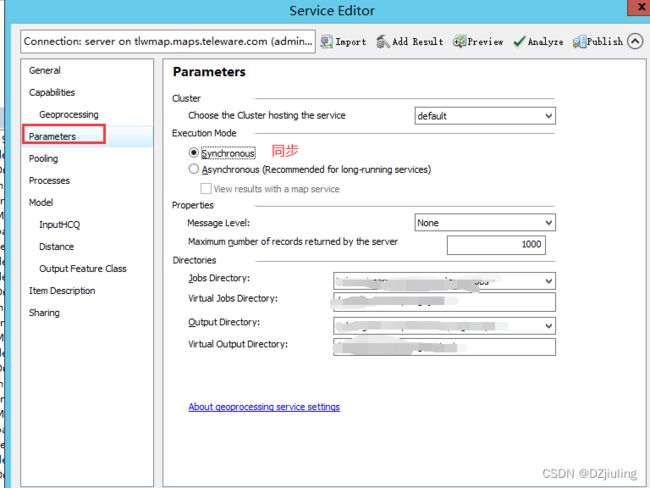
5、设置发布的服务参数,优先选择同步服务,如图
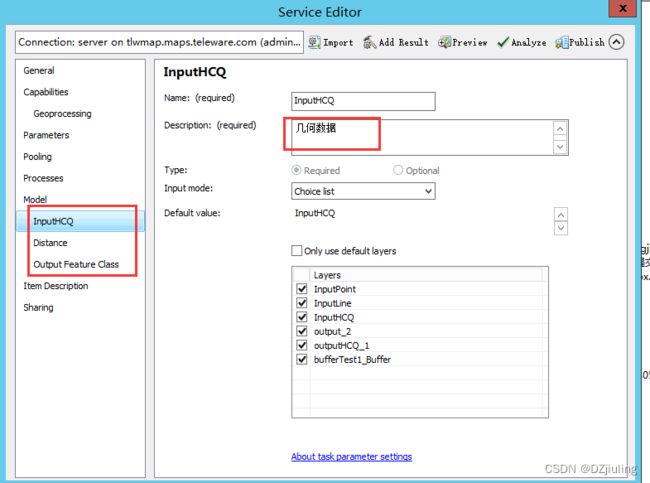
可对Model中的参数,进行描述
7、设置完成后点击Analyze分析,分析如果没有错误,使用Publish发布GP服务
代码部分
绘制线条
 const graphic = new self.Graphic({
            geometry: new self.Polyline({
              paths: polygon2,
              spatialReference: self.map.spatialReference
            }),
            symbol: {
              type: 'simple-line',
              color: [255, 255, 255],
              style: 'solid',
              width: 2
            }
          })
通过Geoprocessor请求GP服务,url即为gp服务的url,graphic即为上文中定义的graphic
drawBuffer (graphic) {
      const self = this
      const featureSet = new this.FeatureSet()
      featureSet.features = [graphic]
      const geop = new self.Geoprocessor(url)
      let params = {}
      params['InputHCQ'] = featureSet
      params['Distance'] = {
        distance: self.bufferDistance,
        units: 'esriMeters'
      }
      geop.outSpatialReference = {
        wkid: this.map.spatialReference.wkid
      }
      geop.execute(params).then(data => {
        console.log('测试', data)
        if (data.results.length > 0) {
          const graphic1 = new self.Graphic({
            geometry: data.results[0].value.features[0].geometry,
            symbol: {
              type: 'simple-fill',
              color: [0, 0, 255, 0.1],
              style: 'solid',
              outline: {
                color: 'white',
                width: 2
              }
            }
          })
          self.map.graphics.add(graphic1)
        }
      })
    },
效果如下


