R语言箱型图 boxplot
boxplot简介
boxplot称为箱型图,又叫做盒状图,胡须图。是用来表示数值类型数据分布状况的统计图。它能显示出一组数据的最大值、最小值、中位数、及上下四分位数。
 四分位数百度百科
第一四分位数 (Q1),又称“较小四分位数”,等于该样本中所有数值由小到大排列后第25%的数字。
第二四分位数 (Q2),又称“中位数”,等于该样本中所有数值由小到大排列后第50%的数字。
第三四分位数 (Q3),又称“较大四分位数”,等于该样本中所有数值由小到大排列后第75%的数字。
第三四分位数与第一四分位数的差距又称四分位距(InterQuartile Range,IQR)。
IQR = Q3-Q1
最大值(maximum): Q3 + 1.5IQR
最小值(minimum): Q1 -1.5IQR
异常值被定义为小于Q1-1.5IQR或大于Q3+1.5IQR的值。
boxplot 方法
boxplot(x, ...)

## S3 method for class 'formula'
boxplot(formula, data = NULL, ..., subset, na.action = NULL,
        drop = FALSE, sep = ".", lex.order = FALSE)

## Default S3 method:
boxplot(x, ..., range = 1.5, width = NULL, varwidth = FALSE,
        notch = FALSE, outline = TRUE, names, plot = TRUE,
        border = par("fg"), col = NULL, log = "",
        pars = list(boxwex = 0.8, staplewex = 0.5, outwex = 0.5),
        horizontal = FALSE, add = FALSE, at = NULL)
R语言的方法boxplot用来画盒状图。
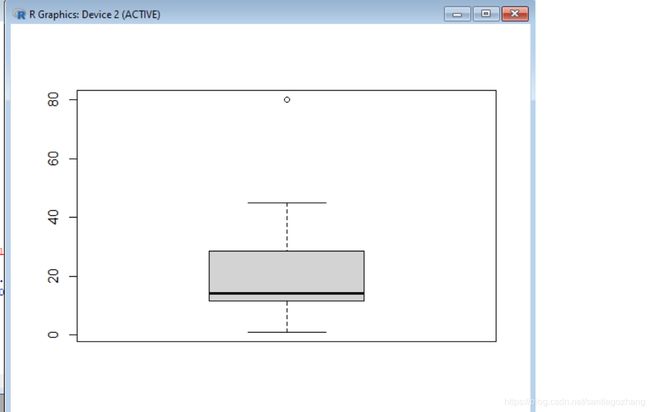
1 简单例子
> testData <- c(1,3,45,23,11,34,12,13,14,15,80)
> summary(testData)
   Min. 1st Qu.  Median    Mean 3rd Qu.    Max.
   1.00   11.50   14.00   22.82   28.50   80.00
> boxplot(testData, col = "lightgray")
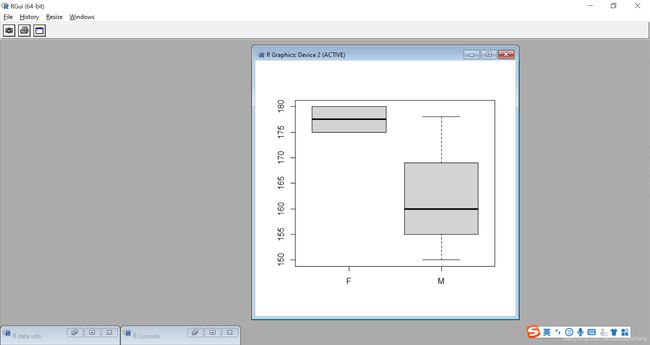
2 盒图分组例子
boxplot有一个参数,formula,比如y~x,表示的就是y被x数据分组。
> height <- c(150, 160, 175, 180, 178)
> gender <- c("M","M","F","F","M")
>
> boxplot(height~gender, col = "lightgray")
>
3 多个属性表示
我们可以在一个盒图上表示多个属性,比如说,基于上面的例子。可以表示身高在性别上的分布,我们还可以在这个盒图上添加体重在性别上的分组分布。
height <- c(150, 160, 175, 180, 178)
weight <- c(50, 60, 75, 80, 78)
gender <- c("M","M","F","F","M")

boxplot(height~gender, at = 1:2 - 0.2, col = "red",  ylim = c(50, 200))
boxplot(weight~gender,  at = 1:2 + 0.2, col = "yellow",add=TRUE)
 4 属性的归一化处理
上面的盒图由于属性身高的取值和体重取值相差太大。这样画出来的图比例不合适。我们可以做一个简单的归一化处理。
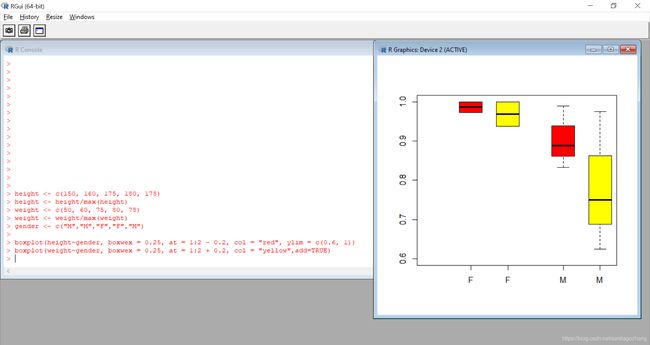
height <- c(150, 160, 175, 180, 178)
height <- height/max(height)
weight <- c(50, 60, 75, 80, 78)
weight <- weight/max(weight)
gender <- c("M","M","F","F","M")

boxplot(height~gender, boxwex = 0.25, at = 1:2 - 0.2, col = "red", ylim = c(0.6, 1))
boxplot(weight~gender, boxwex = 0.25, at = 1:2 + 0.2, col = "yellow",add=TRUE)
这里需要说明的是,需要根据不同的数据去调整不同的参数画出合适比例的图。
例子里面用到了boxwex,ylim.