3、SkyWalking部署之Linux环境(SkyWalking Linux环境部署)
| 文件状态: [ ] 草稿 [√] 正在修改 |
当前版本 |
1.0 |
| 历史修订版本 |
1.0; |
|
| 作 者 |
杜有龙 |
|
| 完成日期 |
2019-01-23 |
一、版本要求
- SkyWalking5.0.0-GA
- ElasticSearch-5.x
注意6.X版本不支持;新版本的skywalking使用ES作为存储,所以先安装es。
- JDK8+ (SkyWalking collector和WebUI部署在jdk8及以上版本)
- JDK6+(被监控的应用程序运行在jdk6及以上版本)
- 其他
二、地址
- apache官网下载地址
http://skywalking.apache.org/downloads/
- gitlib部署文档
https://github.com/apache/incubator-skywalking/blob/v5.0.0-alpha/docs/README_ZH.md
- 项目地址
https://github.com/OpenSkywalking/skywalking-netcore
三、架构图
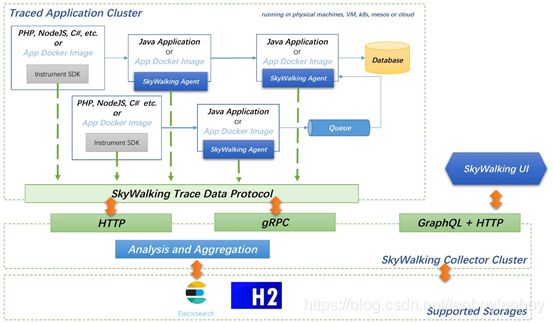
四、部署过程
【参考】
https://blog.csdn.net/y_h_d/article/details/83342846
https://blog.csdn.net/jilo88/article/details/81355265
1、Elasticsearch
1.1 配置
修改config/elasticsearch.yml文件
- 设置
<1>、设置 cluster.name: CollectorDBCluster
collector配置文件中的clusterName值需要和该名称一致。
-如:
collector的配置文件config\application.yml,其中配置为
clusterName: CollectorDBCluster。如下图

<2>、设置 node.name: CollectorDBCluster1
可以设置为任意名字,如Elasticsearch为集群模式,则每个节点名称需要不同。
- 增加如下配置
# ES监听的ip地址
network.host: 0.0.0.0
thread_pool.bulk.queue_size: 1000
1.2 验证
使用ip:9200访问

注:其中,红色涂抹部分为部署ES进程所在的主机IP地址
2、SW-collector
2.1 端口要求
确保端口10800,11800,12800不被占用
2.2 存储要求
collector配置ElasticSearch作为运行存储介质
2.3 时间设置要求
被监控应用的宿主服务器系统时间(包含时区)与collectors,UIs部署的宿主服务器时间设置正确且相同
2.4 配置
2.4.1位置
..\config\application.yml
2.4.2配置项解释
【官方解释】
下面是关于collector连接配置的5种类型方式
<1>、naming :agent使用HTTP协议连接collectors
<2>、agent_gRPC :agent使用gRPC协议连接collectors
<3>、remote :Collector使用gRPC协议连接collector
<4>、ui :使用HTTP协议连接collector,(大多数情况不需要修改)
<5>、agent_jetty:agent使用HTTP协议连接collectors(可选连接)
2.4.3配置内容-参考1
【官方解释-cluster方式】
cluster:
# The Zookeeper cluster for collector cluster management.
zookeeper:
hostPort: localhost:2181
sessionTimeout: 100000
naming:
# Host and port used for agent config
jetty:
# 配置agent发现collector集群,host必须要系统真实网络ip地址. agent --(HTTP)--> collector
host: localhost
port: 10800
contextPath: /
remote:
gRPC:
# 配置collector节点在集群中相互通信,host必须要系统真实网络ip地址.
# collectorN --(gRPC) --> collectorM
host: localhost
port: 11800
agent_gRPC:
gRPC:
# 配置agent上传(链路跟踪和指标)数据到collector,host必须要系统真实网络ip地址. agent--(gRPC)--> collector
host: localhost
port: 11800
agent_jetty:
jetty:
# 配置agent上传(链路跟踪和指标)数据到collector,host必须要系统真实网络ip地址. agent--(HTTP)--> collector
# SkyWalking native Java/.Net/node.js agents don't use this.
# Open this for other implementor.
host: localhost
port: 12800
contextPath: /
analysis_register:
default:
analysis_jvm:
default:
analysis_segment_parser:
default:
bufferFilePath: ../buffer/
bufferOffsetMaxFileSize: 10M
bufferSegmentMaxFileSize: 500M
ui:
jetty:
# 配置UI访问collector,host必须要系统真实网络ip地址.
host: localhost
port: 12800
contextPath: /
# 配置Elasticsearch 集群连接信息
storage:
elasticsearch:
clusterName: CollectorDBCluster
clusterTransportSniffer: true
clusterNodes: localhost:9300
indexShardsNumber: 2
indexReplicasNumber: 0
highPerformanceMode: true
# 设置统计指标数据的失效时间,当指标数据失效时系统将数据自动删除.
traceDataTTL: 90 # 单位为分
minuteMetricDataTTL: 45 # 单位为分
hourMetricDataTTL: 36 # 单位为小时
dayMetricDataTTL: 45 # 单位为天
monthMetricDataTTL: 18 # 单位为月
configuration:
default:
# namespace: xxxxx
# 告警阀值
applicationApdexThreshold: 2000
serviceErrorRateThreshold: 10.00
serviceAverageResponseTimeThreshold: 2000
instanceErrorRateThreshold: 10.00
instanceAverageResponseTimeThreshold: 2000
applicationErrorRateThreshold: 10.00
applicationAverageResponseTimeThreshold: 2000
# 热力图配置,修改配置后需要删除热力指标统计表,由系统重建
thermodynamicResponseTimeStep: 50
thermodynamicCountOfResponseTimeSteps: 40
2.4.4配置内容-参考2
#cluster:
# zookeeper:
# hostPort: localhost:2181
# sessionTimeout: 100000
naming:
jetty:
#OS real network IP(binding required), for agent to find collector cluster
host: 192.168.0.3
# 部署collector的主机IP地址
port: 10800
contextPath: /
cache:
# guava:
caffeine:
remote:
gRPC:
# OS real network IP(binding required), for collector nodes communicate with each other in cluster. collectorN --(gRPC) --> collectorM
host: 192.168.0.3
# 部署collector的主机IP地址
port: 11800
agent_gRPC:
gRPC:
#OS real network IP(binding required), for agent to uplink data(trace/metrics) to collector. agent--(gRPC)--> collector
host: 192.168.0.3
# 部署collector的主机IP地址
port: 11800
# Set these two setting to open ssl
#sslCertChainFile: $path
#sslPrivateKeyFile: $path
# Set your own token to active auth
#authentication: xxxxxx
agent_jetty:
jetty:
# OS real network IP(binding required), for agent to uplink data(trace/metrics) to collector through HTTP. agent--(HTTP)--> collector
# SkyWalking native Java/.Net/node.js agents don't use this.
# Open this for other implementor.
host: 192.168.0.3
# 部署collector的主机IP地址
port: 12800
contextPath: /
analysis_register:
default:
analysis_jvm:
default:
analysis_segment_parser:
default:
bufferFilePath: ../buffer/
bufferOffsetMaxFileSize: 10M
bufferSegmentMaxFileSize: 500M
bufferFileCleanWhenRestart: true
ui:
jetty:
# Stay in `localhost` if UI starts up in default mode.
# Change it to OS real network IP(binding required), if deploy collector in different machine.
host: 192.168.0.3
# 部署collector的主机IP地址
port: 12800
contextPath: /
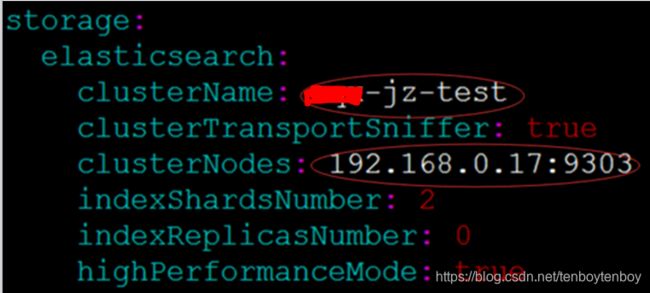
storage:
elasticsearch:
clusterName: CollectorDBCluster
# Elasticsearch的cluster.name值
clusterTransportSniffer: true
clusterNodes: 172.21.123.99:9300
# Elasticsearch的ip和端口
indexShardsNumber: 2
indexReplicasNumber: 0
highPerformanceMode: true
# Batch process setting, refer to https://www.elastic.co/guide/en/elasticsearch/client/java-api/5.5/java-docs-bulk-processor.html
bulkActions: 2000 # Execute the bulk every 2000 requests
bulkSize: 20 # flush the bulk every 20mb
flushInterval: 10 # flush the bulk every 10 seconds whatever the number of requests
concurrentRequests: 2 # the number of concurrent requests
# Set a timeout on metric data. After the timeout has expired, the metric data will automatically be deleted.
traceDataTTL: 90 # Unit is minute
minuteMetricDataTTL: 90 # Unit is minute
hourMetricDataTTL: 36 # Unit is hour
dayMetricDataTTL: 45 # Unit is day
monthMetricDataTTL: 18 # Unit is month
#storage:
# h2:
# url: jdbc:h2:~/memorydb
# userName: sa
configuration:
default:
#namespace: xxxxx
# alarm threshold
applicationApdexThreshold: 2000
serviceErrorRateThreshold: 10.00
serviceAverageResponseTimeThreshold: 2000
instanceErrorRateThreshold: 10.00
instanceAverageResponseTimeThreshold: 2000
applicationErrorRateThreshold: 10.00
applicationAverageResponseTimeThreshold: 2000
# thermodynamic
thermodynamicResponseTimeStep: 50
thermodynamicCountOfResponseTimeSteps: 40
# max collection's size of worker cache collection, setting it smaller when collector OutOfMemory crashed.
workerCacheMaxSize: 10000
#receiver_zipkin:
# default:
# host: localhost
# port: 9411
# contextPath: /
注:其中,配置连接远程测试环境中的ES,目前配置如下:
2.5 启动
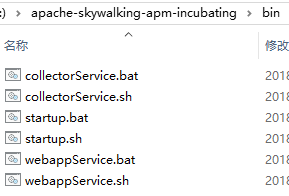
如果单独启动collector,运行脚本bin/collectorService.sh

2.6 验证
http://ip:10800/agent/jetty

注:其中,红色涂抹部分为部署collector进程所在的主机IP地址
3、SW-Web UI
3.1 位置
Web UI的配置项保存在**\webapp\webapp.yml中
3.2 配置
listOfServers配置
collector的访问服务名称与config/application.yml中naming.jetty配置保持相同, 且若是多个collector服务名称用','分隔。
修改collector.ribbon.listOfServers如下图:
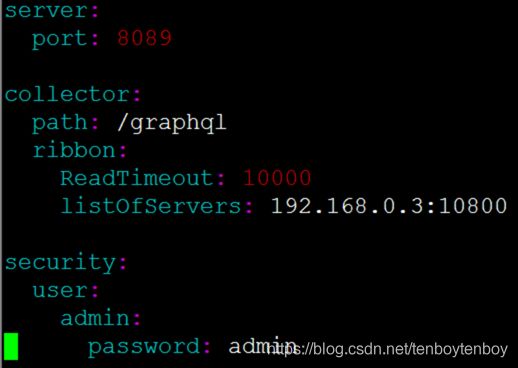
端口配置
- 修改原因
web的默认监听端口是8080,与tomcat默认端口冲突。修改该端口。
- 修改

collector.path
collector 查询uri地址. 默认是/graphql
collector.ribbon.ReadTimeout
查询超时时间,默认是10秒
security.user.*
登录用户名/密码. 默认是 admin/admin
3.2.3 启动
如果单独启动UI,运行脚本 bin/webappService.sh
3.2.4 验证
http://ip:8089
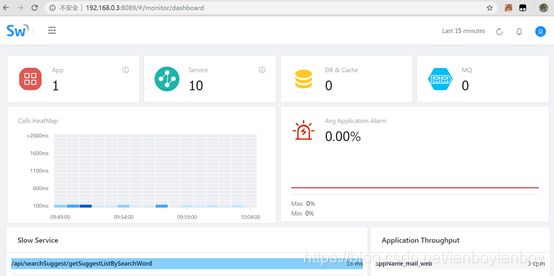
注:要验证web iu数据,需要先配置agent和所要监控的服务。
4、SW-Agent
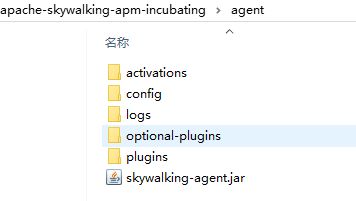
4.1 拷贝目录
拷贝agent目录到所需位置(一般为应用程序所在磁盘)。日志、插件和配置都包含在包中,请不要改变目录结构。
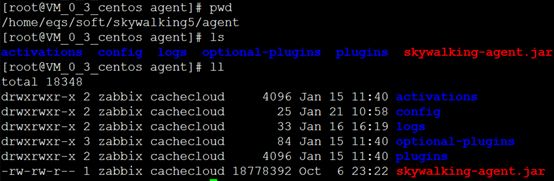
目录结构如下所示:
4.2 位置
agent\config目录中的agent.config
4.3 配置
4.3.1、基本配置
#为自己的应用名-即为被监控的程序起的名称
agent.application_code=MY_APPName_01
#对应collector配置中的 naming
collector.servers=192.168.0.3:10800
4.3.2、其他配置
# 日志文件名称前缀
logging.file_name=skywalking-agent.log
# 日志文件最大大小
# 如果超过此大小,则会生成新文件。
# 默认为300M
logging.max_file_size=314572800
# 日志级别,默认为DEBUG。
logging.level=DEBUG
5、监控Tomcat、spring boot
配置需要监控的应用的agent探针
agent目录结构如下图所示
5.1版本要求
JDK6+(被监控的应用程序运行在jdk6及以上版本)
5.2配置
5.2.1监控tomcat实例
在catalina.sh脚本中添加一项:
CATALINA_OPTS="$CATALINA_OPTS -javaagent:/home/eqs/soft/skywalking5/agent/skywalking-agent.jar";
export CATALINA_OPTS
注:/home/eqs/soft/skywalking5/agent为agent所在目录。
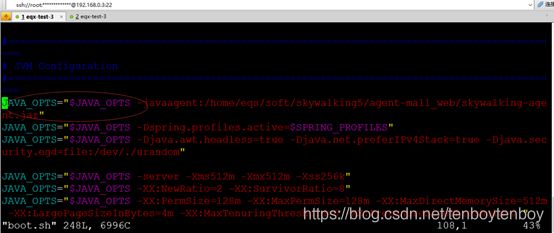
5.2.2监控spring boot工程
如果是spring boot工程,在自定义的boot.sh脚本中添加一项:
JAVA_OPTS="$JAVA_OPTS -javaagent:/home/eqs/soft/skywalking5/agent-mall_web/skywalking-agent.jar"
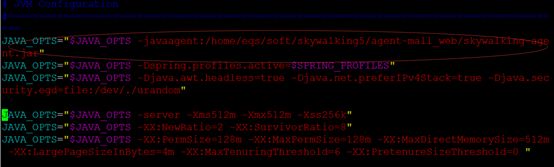
注:/home/eqs/soft/skywalking5/agent为agent所在目录。
- 启动顺序
1、ElasticSearch
启动elasticsearch.sh
2、SkyWalking
A、分别启动collectorService.sh、webappService.sh
- 或者启动startup.sh,使用bin/startup.sh则同时启动collector和web
3、启动被监控的程序
配置参考“四-5”描述
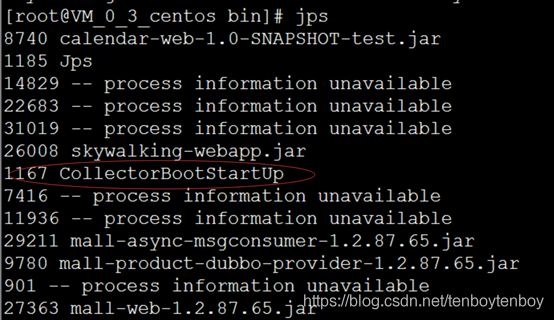
- 关闭进程
1、关闭collector
1.1、查看CollectorBootStartUp 的PID
执行jps命令:
![]()
1.2、关闭CollectorBootStartUp
执行kill命令:
kill -9 30058
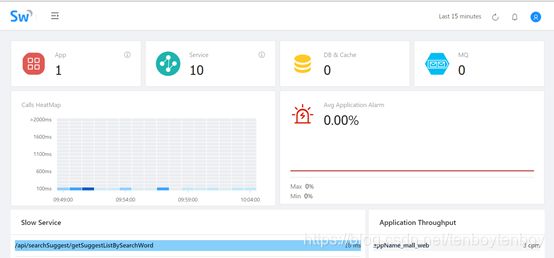
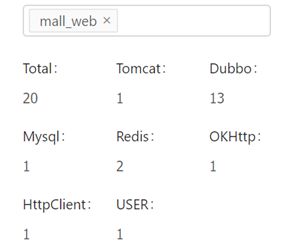
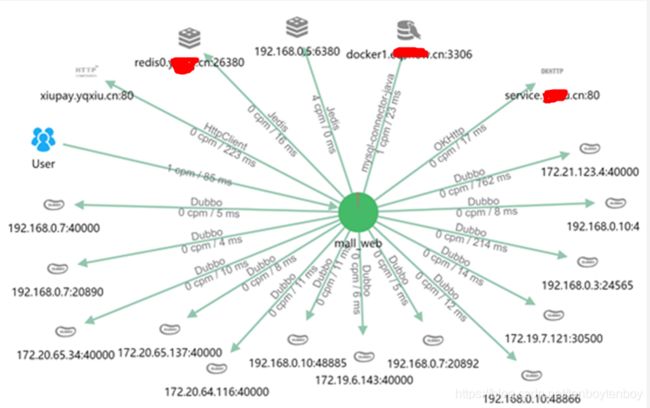
- 监控结果
八、参考资源
(一)、环境部署--社区
1、网络
https://blog.csdn.net/y_h_d/article/details/83342846
https://blog.csdn.net/zhangkang65/article/details/78991760
2、端口修改skywalking 8080 端口 修改
https://my.oschina.net/ytqvip/blog/1793767
3、社区
docker环境:
https://www.cnblogs.com/liguobao/p/9686310.html
4、版本5.X
A类
es环境安装:
http://blog.51cto.com/zero01/2130696
高级特性
https://blog.csdn.net/jilo88/article/details/81355265
https://blog.csdn.net/SoberChina/article/details/79315242
https://blog.csdn.net/qq_42281649/article/details/82804703
5、独到总结
https://blog.csdn.net/qq_36236890/article/details/79647017
6、官方社区
https://github.com/OpenSkywalking/Community
7、高级部署
http://blog.51cto.com/536410/2318051
8、APM、Google
pass==++++https://www.cnblogs.com/xiaoqi/p/apm.html
(二)、环境部署--官方--文档
1、官方
中文
https://github.com/apache/incubator-skywalking/blob/5.x/docs/README_ZH.md
--英文
https://github.com/apache/incubator-skywalking
2、Docker
https://github.com/JaredTan95/skywalking-docker
3、如何构建项目
https://github.com/apache/incubator-skywalking/blob/master/docs/en/guides/How-to-build.md
(三)、高级特性
1、个性化服务过滤
https://github.com/apache/incubator-skywalking/blob/5.x/apm-sniffer/optional-plugins/trace-ignore-plugin/README_CN.md
https://blog.csdn.net/u013095337/article/details/80452088
2、版本、
https://github.com/SkywalkingTest/agent-integration-test-report#dubbo
(四)、理论、深入研究文章
1、架构设计-系列文章
https://github.com/apache/incubator-skywalking/blob/5.x/docs/cn/Architecture-CN.md
https://blog.csdn.net/Saphulot/article/details/81739411
pass==https://www.jianshu.com/p/2fd56627a3cf
2、全面深入分析
https://juejin.im/post/5a7a9e0af265da4e914b46f1
3、全面学习
http://www.iocoder.cn/categories/SkyWalking/
4、10加文章
https://juejin.im/post/5ab5b0e26fb9a028e25d7fcb
5、skywalking源码分析之javaAgent工具ByteBuddy的应用
http://www.kailing.pub/article/index/arcid/178.html
6、谷歌论文《 Dapper,大规模分布式系统的跟踪系统》
http://bigbully.github.io/Dapper-translation/
(五)、监控应用
https://www.jianshu.com/p/3ddd986c7581
https://www.cnblogs.com/huangxincheng/p/9666930.html
(六)、APM常见技术对比
https://blog.csdn.net/u012394095/article/details/79700200
https://www.jianshu.com/p/0fbbf99a236e
https://www.cnblogs.com/davidwang456/articles/8119047.html
(七)、UI
https://blog.csdn.net/qq_36236890/article/details/79647017
http://blog.zollty.com/b/archive/apm-comparison-of-skywalking-and-pinpiont.html