- JavaSE : 注解 Annotation
Edenyt
java-eejava
注解Java中的注解(Annotation)是一种元数据形式,用于向编译器或JVM提供有关程序元素(如类、方法、变量、参数和包)的附加信息。注解不会直接影响程序的行为或结构,但它们可以被编译器、开发工具或运行时环境用于生成代码、进行验证、执行处理或提供信息。以下是关于Java注解的几个关键点:1.注解的种类1.1.内置标准注解:@Override:指示一个方法覆盖了超类中的方法。@Deprecat
- Java内存与缓存
C6666888
java专栏java开发语言
Java内存管理和缓存机制是构建高性能应用程序的关键要素。它们之间既有联系又有区别,理解这两者对于优化Java应用至关重要。Java内存模型Java内存模型(JMM)定义了线程如何以及何时可以看到其他线程修改过的共享变量的值,并且规定了所有线程在读取或写入共享变量时必须遵循的一些规则。根据JVM规范,Java运行时数据区可以分为以下几个部分:程序计数器:每个线程都有自己的程序计数器,它记录当前线程
- Java语言特点及面试常考问题
土豆尼尼酱
java
未完待续…文章目录Java语言的特点面试常考问题及要点一、基础概念二、面向对象三、集合框架四、多线程五、JVM六、异常处理七、设计模式八、新特性(JDK8+)Java语言的特点跨平台性(一次编写,到处运行)通过JVM(Java虚拟机)实现,字节码可在任何安装JVM的设备上运行。面向对象(OOP)支持封装、继承、多态,所有代码必须定义在类中。自动内存管理(垃圾回收,GC)开发者无需手动释放内存,JV
- 「热」Java 面试八股文之虚拟机篇
java晴天过后
java面试经验分享
Java虚拟机篇简述JVM内存模型线程私有的运行时数据区:程序计数器、Java虚拟机栈、本地方法栈。线程共享的运行时数据区:Java堆、方法区。简述程序计数器程序计数器表示当前线程所执行的字节码的行号指示器。程序计数器不会产生StackOverflowError和OutOfMemoryError。简述虚拟机栈Java虚拟机栈用来描述Java方法执行的内存模型。线程创建时就会分配一个栈空间,线程结束
- 分布式服务监控
点滴~
分布式
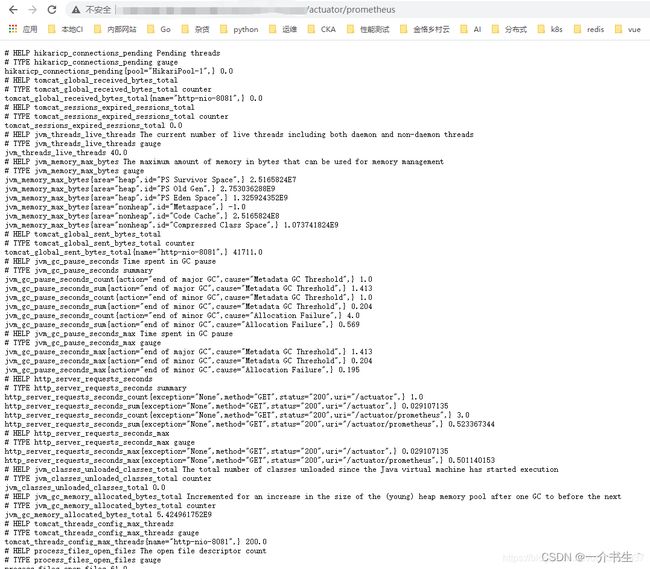
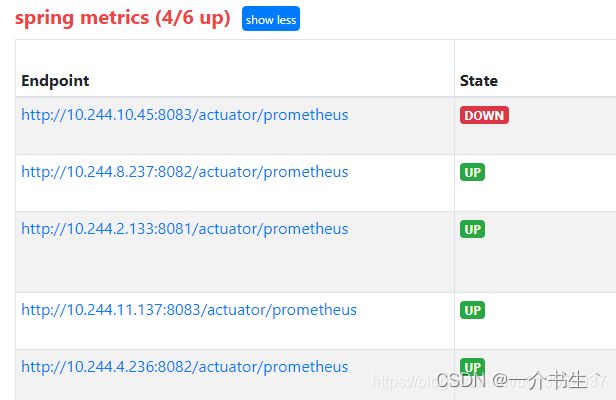
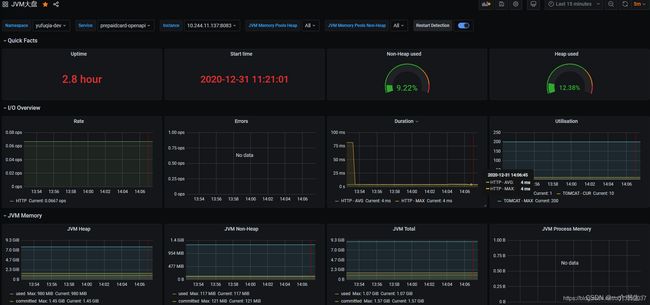
目录分布式服务监控CAT(CentralApplicationTracking)监控对象和指标分布式服务监控分布式服务监控在保障分布式系统稳定运行中至关重要,通过各类监控组件对关键指标进行监测,能及时发现并解决问题。下面将从监控组件、其优缺点、监控指标及其作用展开介绍。监控组件Prometheus:一个开源的系统监控和报警工具包。它采用拉取式采集数据,支持多种数据采集方式,如直接采集应用程序暴露的
- 案例分析:大对象复用的目标和注意点15
是小旭啊
mybatisniodubbo
对于“大对象”的优化。这里的“大对象”,是一个泛化概念,它可能存放在JVM中,也可能正在网络上传输,也可能存在于数据库中。那么为什么大对象会影响我们的应用性能呢?第一,大对象占用的资源多,垃圾回收器要花一部分精力去对它进行回收;第二,大对象在不同的设备之间交换,会耗费网络流量,以及昂贵的I/O;第三,对大对象的解析和处理操作是耗时的,对象职责不聚焦,就会承担额外的性能开销。结合我们前面提到的缓存,
- 记一次线上tomcat访问慢的排查过程
a_sunny_a
tomcatjava
记一次线上tomcat访问慢的排查过程排查步骤top命令导出jvm栈的使用情况查看当前进程的线程数(ps-T-ppid|wc-l)解决方法tomcat问题排查经常使用的命令排查步骤top命令使用top命令查看cpu使用率发现cpu使用率并不高导出jvm栈的使用情况jvm栈内存足够使用,并且并未抛出溢出的异常查看当前进程的线程数(ps-T-ppid|wc-l)线程数为295(偏高),于是查看线上to
- [k8s源码]9.workqueue
weixin_45396500
k8s源码java开发语言
client-go是一个库,提供了与KubernetesAPI服务器交互的基础设施。它提供了诸如Informer、Lister、ClientSet等工具,用于监听、缓存和操作Kubernetes资源。而自定义控制器则利用这些工具来实现特定的业务逻辑和自动化任务。业务逻辑实现:client-go不包含特定的业务逻辑。自定义控制器允许实现特定于您的应用程序或需求的逻辑。扩展Kubernetes:通过自
- 作为一名测试工程师如何学习Kubernetes(k8s)技能
网络安全小宇哥
学习kubernetes容器计算机网络web安全安全dubbo
前言Kubernetes(K8s)作为云原生时代的关键技术之一,对于运维工程师、开发工程师以及测试工程师来说,都是一门需要掌握的重要技术。作为一名软件测试工程师,学习Kubernetes是一个有助于提升自动化测试、容器化测试以及云原生应用测试能力的重要过程。以下是一个系统性的学习路径和建议:一、了解基础概念1)容器技术:学习Docker等容器技术的基础知识,了解容器的基本概念、镜像、容器运行与管理
- Java 编程基础:开启编程世界的大门
安年CJ
JAVAjava开发语言算法
一、Java环境搭建在开始编写Java代码之前,我们需要先搭建Java开发环境。1.安装JDK(JavaDevelopmentKit)JDK是Java开发的核心工具包,它包含了编译Java源文件所需的编译器(javac)以及运行Java程序的虚拟机(JavaVirtualMachine,JVM)等工具。你可以从Oracle官方网站下载适合你操作系统的JDK版本。下载完成后,按照安装向导进行安装。安
- 深入理解 Kubernetes 命名空间:高效管理与隔离资源的关键
简单简单小白
kubernetes贪心算法java
深入理解Kubernetes命名空间:高效管理与隔离资源的关键目录深入理解Kubernetes命名空间:高效管理与隔离资源的关键什么是命名空间?命名空间的作用1.资源隔离2.多租户支持3.资源管理和策略控制4.简化管理创建和使用命名空间命名空间与集群中的其他资源结语在Kubernetes(k8s)中,命名空间(Namespace)是资源隔离和组织管理的核心概念之一。本文将详细探讨命名空间的作用,以
- Kubernetes 从入门到精通:解锁容器编排的终极指南 [特殊字符]
a小胡哦
kubernetes容器云原生
为什么需要Kubernetes?Kubernetes(简称K8s)是容器编排领域的王者,它能帮你:自动扩缩容:流量激增时自动扩展应用实例(HorizontalPodAutoscaler)自愈能力:崩溃的容器秒级重启,节点故障自动迁移(Self-Healing设计)服务发现:动态管理微服务通信(Service机制)存储编排:一键挂载云存储/本地磁盘(PersistentVolumes)跨环境部署:一
- Java中的堆外内存:DirectByteBuffer与Unsafe
吴晓斌kobe
Java学习java堆外内存Unsafe
在Java中,堆内存(Heap)是JVM管理的内存区域,用于存储对象实例。然而,Java还支持使用堆外内存(Off-HeapMemory),即直接操作操作系统分配的内存。堆外内存的使用场景广泛,尤其是在需要高性能、低延迟的应用中,如网络通信、文件IO、大数据处理等。本文将深入探讨堆外内存的使用场景、性能优势及潜在风险,并通过代码实战展示如何使用DirectByteBuffer和Unsafe来操作堆
- 基于Prometheus和Grafana的现代服务器监控体系构建
丁爸
运维服务器
1.简介1.1.概述基于Prometheus和Grafana的现代服务器监控体系是一种高效、灵活的监控解决方案,广泛应用于云计算和微服务架构的环境中。以下是这一监控体系的概述:Prometheus:Prometheus是一个开源的系统监控和警报工具包,由SoundCloud开发并维护。它具有强大的数据收集能力、灵活的查询语言以及与微服务架构的无缝集成。Prometheus的核心概念包括时间序列数据
- Jenkins升级后报错解决
暴走的小海星
SpingbootDockerdockerjenkins服务器
如果您需要升级Jenkins以及JVM,我们建议您:备份JENKINS_HOME将Jenkins升级到最新版本○您如何升级Jenkins取决于您最初如何安装Jenkins。○我们建议您使用系统的包管理器(例如apt或yum)。验证升级以确认所有插件和作业都已加载升级所需的插件(参见升级插件)JENKINS_HOME升级Jenkins和所需的插件后进行第二次备份停止Jenkins实例升级运行Jenk
- 深入探讨K8s资源管理和性能优化
磐基Stack专业服务团队
Kuberneteskubernetes性能优化容器
#作者:曹付江文章目录前言:1.监控Kubernetes集群的资源利用率1.1Prometheus1.2Kubernetes度量服务器1.3Grafana1.4自定义指标2.识别资源瓶颈2.1.监控工具2.2.性能剖析2.3Kubernetes事件和日志2.4.群集自动扩展2.5.负载测试3.扩展应用程序以提高性能3.1.水平Pod自动缩放器(HPA)3.2.垂直PodAutoscaler(VPA
- JVM 高级面试题及答案整理,最新面试题
扫地僧009
互联网大厂面试题jvmjava面试
JVM中的垃圾收集器有哪些,它们的工作原理是什么?JVM中的垃圾收集器主要包括以下几种:1、Serial收集器:它是一个单线程收集器,工作时会暂停所有其他工作线程("Stop-The-World"),它的优点是简单高效(与其他收集器的单线程比),适用于单核处理器的环境。2、ParNew收集器:可以看作是Serial收集器的多线程版本,主要用于新生代的垃圾收集,适合多核处理器环境。3、Paralle
- Java Enum 类型来实现单例模式,为什么是天然是线程安全
阿豆学编程
Javajava-设计模式java单例模式开发语言
在Java中,使用enum类型来实现单例模式被认为是天然线程安全的,这是因为enum在Java中具有一些特殊的行为和特性,使得它非常适合用来实现单例模式。Java规范确保了enum类型是线程安全的,并且只有一个实例存在,下面是为什么enum类型能够天然线程安全的几个关键点。1.JVM保证枚举实例的唯一性在Java中,enum类型是由JVM来加载和管理的。当枚举类被加载时,JVM会确保每个枚举值(即
- 运维案例之记一次Kubernetes集群证书过期或延期操作处理实践指南
全栈工程师修炼指南
云原生落地实用指南kubernetes运维docker容器云原生
欢迎关注「WeiyiGeek」公众号点击下方卡片即可关注我哟!设为「星标⭐」每天带你基础入门到进阶实践再到放弃学习!涉及网络安全运维、应用开发、物联网IOT、学习路径、个人感悟等知识“花开堪折直须折,莫待无花空折枝。”作者主页:[https://www.weiyigeek.top]作者博客:[https://blog.weiyigeek.top]作者答疑学习交流群:
- java基本常识
Forworder
java开发语言jvmjava-eeservlet
Java程序的结构由如下三个部分组成:类存在于源文件里面;方法存在于类中;语句存在于方法中。java程序编译过程JDKJREJVM三者关系JDK(JavaDevelopmentKit):Java开发工具包,提供给Java程序员使用,包含了JRE,同时还包含了编译器javac与自带的调试工具Jconsole、jstack等。JRE(JavaRuntimeEnvironment):Java运行时环境,
- Kubernetes (K8S) 高效使用技巧与实践指南
挣扎与觉醒中的技术人
kubernetes容器云原生网络
Kubernetes(K8S)作为容器编排领域的核心工具,其灵活性和复杂性并存。本文结合实战经验,从运维效率提升、生产环境避坑、核心功能应用等维度,总结高频使用技巧与最佳实践,分享如何快速掌握K8S。一、kubectl高效操作技巧1.自动补全与上下文切换kubectl是操作K8S的核心命令行工具,通过以下配置可大幅提升操作效率:#Bash自动补全source快速切换目标集群。2.YAML模板生成与
- Kubernetes 1.29升级至1.31版本笔记
zkyqss
云计算笔记kubernetes云原生
一、概述之前安装了kubernetes1.29(参见:使用kubeadm安装Kubernetes1.29)。本次计划将该集群升级为1.31版本。Kubernetes版本表示方式:Kubernetes版本表示为x.y.z,其中x是主版本,y是次版本,z是补丁版本。建议升级顺序在Kubernetes中,推荐的升级方法是逐步升级,即一次升级一个次版本。本次集群升级策略1.29升级至→1.30,然后1.3
- 《深入理解JVM》实战笔记(五):线程安全与锁优化
西瓜拍两瓣
jvm笔记java
序言多线程编程是现代计算机系统中不可或缺的一部分,尤其在高并发、大规模分布式系统中,线程安全问题直接影响程序的稳定性和性能。本篇博客将深入剖析线程安全的基本概念与实现原理,详细解析锁的优化方案,结合JVM内部实现,帮助开发者编写高效、稳定的并发程序。1.线程安全的基本概念1.1线程安全的定义在多线程环境下,线程安全指的是多个线程并发执行时,程序能够保证数据的正确性、可见性和原子性。当多个线程访问共
- 在k8s中,如何在argocd中添加proxy
网络飞鸥
kubernetesargocd容器
在Kubernetes的ArgoCD中添加代理(Proxy)设置,你可以从多个层面进行操作,下面分别介绍不同组件设置代理的方法。1.ArgoCDServer代理设置ArgoCDServer负责提供WebUI和API服务,要为其设置代理,可以通过修改ArgoCDServer的部署配置来实现。步骤:编辑ArgoCDServer部署kubectleditdeploymentargocd-server-n
- 高版本k8s文件无法识别镜像
虚魍
kubernetes容器运维linux云计算
Kubernetes1.24正式移除了dockershim组件,意味着原生Docker容器运行时不再直接支持。集群管理员需要迁移至其他兼容的容器运行时,如containerd或CRI-O。高版本k8s不在支持docker运行容器运行服务,而使用ctr命令来识别pod文件的镜像。-----如有问题,请提醒,我会及时改正。解决yaml文件识别不到镜像:方法一:手动拉取,上传先拉取相应镜像:docker
- 必知必会!如何在Kubernetes中管理Configurations和Secrets
硅基创想家
#Kubernetes实战与经验kubernetes容器云原生
在Kubernetes中,管理配置和机密信息对于确保应用程序的灵活性、安全性和易于部署至关重要。当应用程序依赖于配置或敏感数据(如API密钥、密码和环境变量)时,Kubernetes提供了将这些数据与应用程序代码分离的工具。Kubernetes中的ConfigMaps(配置映射)和Secrets(机密)使得动态管理和更新这些配置成为可能,让您的应用程序能够在不直接在容器中硬编码信息的情况下进行适配
- 云平台结合DeepSeek的AI模型优化实践:技术突破与应用革新
荣华富贵8
程序员的知识储备1经验分享
云平台与AI模型的深度结合已成为推动人工智能技术落地的重要驱动力。DeepSeek(深度求索)作为前沿AI模型的代表,通过与云计算的深度融合,在技术架构和应用场景层面实现了突破性进展。以下从技术突破和应用革新两个维度进行系统解析:---###**一、技术突破:云原生AI架构的进化**####1.**弹性算力调度体系**-**动态资源分配**:基于Kubernetes的智能调度器实现GPU资源的细粒
- volatile的底层实现
一个儒雅随和的男子
多线程java并发
前言volatile主要有两个作用:保证可见性和禁止指令重排序。可见性是指当一个线程修改了volatile变量的值,其他线程能立即看到这个修改。禁止重排序是为了避免编译器和处理器对指令的优化导致执行顺序改变,从而引发多线程环境下的问题。如果读者已经知道volatile的基本用法,现在想更深入了解其底层机制。可能是一位Java开发者,正在准备面试,或者在学习多线程编程时遇到了疑问。JVM如何实现vo
- JVM之垃圾回收和调优思路
星星都没我亮
Java虚拟机jvm
文章目录GC的基础知识1.什么是垃圾2.如何定位(找到)垃圾3.常见的垃圾回收算法4.JVM内存分代模型(用于分代垃圾回收算法)5.常见的垃圾回收器常见垃圾回收器组合参数设定:(1.8)JVM调优第一步,了解JVM常用命令行参数PSGC日志详解调优前的基础概念:什么是调优?调优,从规划开始优化环境解决JVM运行中的问题一个案例理解常用工具jconsole远程连接jvisualvm远程连接jprof
- 【Docker基础】理解 Docker:本质、性质、架构与核心组件
卜及中
Docker学习docker架构eureka容器
文章目录Docker本质Docker的引擎迭代Docker和虚拟机的区别Docker为什么比虚拟机资源利用率高,速度快?Docker和JVM虚拟化的区别Docker版本1.LXC(LinuxContainers)2.libcontainer3.Moby4.docker-ce5.docker-ee总结:Docker架构1.Docker仓库(Registry)2.Docker守护进程(Daemon)3
- 设计模式介绍
tntxia
设计模式
设计模式来源于土木工程师 克里斯托弗 亚历山大(http://en.wikipedia.org/wiki/Christopher_Alexander)的早期作品。他经常发表一些作品,内容是总结他在解决设计问题方面的经验,以及这些知识与城市和建筑模式之间有何关联。有一天,亚历山大突然发现,重复使用这些模式可以让某些设计构造取得我们期望的最佳效果。
亚历山大与萨拉-石川佳纯和穆雷 西乐弗斯坦合作
- android高级组件使用(一)
百合不是茶
androidRatingBarSpinner
1、自动完成文本框(AutoCompleteTextView)
AutoCompleteTextView从EditText派生出来,实际上也是一个文本编辑框,但它比普通编辑框多一个功能:当用户输入一个字符后,自动完成文本框会显示一个下拉菜单,供用户从中选择,当用户选择某个菜单项之后,AutoCompleteTextView按用户选择自动填写该文本框。
使用AutoCompleteTex
- [网络与通讯]路由器市场大有潜力可挖掘
comsci
网络
如果国内的电子厂商和计算机设备厂商觉得手机市场已经有点饱和了,那么可以考虑一下交换机和路由器市场的进入问题.....
这方面的技术和知识,目前处在一个开放型的状态,有利于各类小型电子企业进入
&nbs
- 自写简单Redis内存统计shell
商人shang
Linux shell统计Redis内存
#!/bin/bash
address="192.168.150.128:6666,192.168.150.128:6666"
hosts=(${address//,/ })
sfile="staticts.log"
for hostitem in ${hosts[@]}
do
ipport=(${hostitem
- 单例模式(饿汉 vs懒汉)
oloz
单例模式
package 单例模式;
/*
* 应用场景:保证在整个应用之中某个对象的实例只有一个
* 单例模式种的《 懒汉模式》
* */
public class Singleton {
//01 将构造方法私有化,外界就无法用new Singleton()的方式获得实例
private Singleton(){};
//02 申明类得唯一实例
priva
- springMvc json支持
杨白白
json springmvc
1.Spring mvc处理json需要使用jackson的类库,因此需要先引入jackson包
2在spring mvc中解析输入为json格式的数据:使用@RequestBody来设置输入
@RequestMapping("helloJson")
public @ResponseBody
JsonTest helloJson() {
- android播放,掃描添加本地音頻文件
小桔子
最近幾乎沒有什麽事情,繼續鼓搗我的小東西。想在項目中加入一個簡易的音樂播放器功能,就像華為p6桌面上那麼大小的音樂播放器。用過天天動聽或者QQ音樂播放器的人都知道,可已通過本地掃描添加歌曲。不知道他們是怎麼實現的,我覺得應該掃描設備上的所有文件,過濾出音頻文件,每個文件實例化為一個實體,記錄文件名、路徑、歌手、類型、大小等信息。具體算法思想,
- oracle常用命令
aichenglong
oracledba常用命令
1 创建临时表空间
create temporary tablespace user_temp
tempfile 'D:\oracle\oradata\Oracle9i\user_temp.dbf'
size 50m
autoextend on
next 50m maxsize 20480m
extent management local
- 25个Eclipse插件
AILIKES
eclipse插件
提高代码质量的插件1. FindBugsFindBugs可以帮你找到Java代码中的bug,它使用Lesser GNU Public License的自由软件许可。2. CheckstyleCheckstyle插件可以集成到Eclipse IDE中去,能确保Java代码遵循标准代码样式。3. ECLemmaECLemma是一款拥有Eclipse Public License许可的免费工具,它提供了
- Spring MVC拦截器+注解方式实现防止表单重复提交
baalwolf
spring mvc
原理:在新建页面中Session保存token随机码,当保存时验证,通过后删除,当再次点击保存时由于服务器端的Session中已经不存在了,所有无法验证通过。
1.新建注解:
? 1 2 3 4 5 6 7 8 9 10 11 12 13 14 15 16 17 18
- 《Javascript高级程序设计(第3版)》闭包理解
bijian1013
JavaScript
“闭包是指有权访问另一个函数作用域中的变量的函数。”--《Javascript高级程序设计(第3版)》
看以下代码:
<script type="text/javascript">
function outer() {
var i = 10;
return f
- AngularJS Module类的方法
bijian1013
JavaScriptAngularJSModule
AngularJS中的Module类负责定义应用如何启动,它还可以通过声明的方式定义应用中的各个片段。我们来看看它是如何实现这些功能的。
一.Main方法在哪里
如果你是从Java或者Python编程语言转过来的,那么你可能很想知道AngularJS里面的main方法在哪里?这个把所
- [Maven学习笔记七]Maven插件和目标
bit1129
maven插件
插件(plugin)和目标(goal)
Maven,就其本质而言,是一个插件执行框架,Maven的每个目标的执行逻辑都是由插件来完成的,一个插件可以有1个或者几个目标,比如maven-compiler-plugin插件包含compile和testCompile,即maven-compiler-plugin提供了源代码编译和测试源代码编译的两个目标
使用插件和目标使得我们可以干预
- 【Hadoop八】Yarn的资源调度策略
bit1129
hadoop
1. Hadoop的三种调度策略
Hadoop提供了3中作业调用的策略,
FIFO Scheduler
Fair Scheduler
Capacity Scheduler
以上三种调度算法,在Hadoop MR1中就引入了,在Yarn中对它们进行了改进和完善.Fair和Capacity Scheduler用于多用户共享的资源调度
2. 多用户资源共享的调度
- Nginx使用Linux内存加速静态文件访问
ronin47
Nginx是一个非常出色的静态资源web服务器。如果你嫌它还不够快,可以把放在磁盘中的文件,映射到内存中,减少高并发下的磁盘IO。
先做几个假设。nginx.conf中所配置站点的路径是/home/wwwroot/res,站点所对应文件原始存储路径:/opt/web/res
shell脚本非常简单,思路就是拷贝资源文件到内存中,然后在把网站的静态文件链接指向到内存中即可。具体如下:
- 关于Unity3D中的Shader的知识
brotherlamp
unityunity资料unity教程unity视频unity自学
首先先解释下Unity3D的Shader,Unity里面的Shaders是使用一种叫ShaderLab的语言编写的,它同微软的FX文件或者NVIDIA的CgFX有些类似。传统意义上的vertex shader和pixel shader还是使用标准的Cg/HLSL 编程语言编写的。因此Unity文档里面的Shader,都是指用ShaderLab编写的代码,然后我们来看下Unity3D自带的60多个S
- CopyOnWriteArrayList vs ArrayList
bylijinnan
java
package com.ljn.base;
import java.util.ArrayList;
import java.util.Iterator;
import java.util.List;
import java.util.concurrent.CopyOnWriteArrayList;
/**
* 总述:
* 1.ArrayListi不是线程安全的,CopyO
- 内存中栈和堆的区别
chicony
内存
1、内存分配方面:
堆:一般由程序员分配释放, 若程序员不释放,程序结束时可能由OS回收 。注意它与数据结构中的堆是两回事,分配方式是类似于链表。可能用到的关键字如下:new、malloc、delete、free等等。
栈:由编译器(Compiler)自动分配释放,存放函数的参数值,局部变量的值等。其操作方式类似于数据结构中
- 回答一位网友对Scala的提问
chenchao051
scalamap
本来准备在私信里直接回复了,但是发现不太方便,就简要回答在这里。 问题 写道 对于scala的简洁十分佩服,但又觉得比较晦涩,例如一例,Map("a" -> List(11,111)).flatMap(_._2),可否说下最后那个函数做了什么,真正在开发的时候也会如此简洁?谢谢
先回答一点,在实际使用中,Scala毫无疑问就是这么简单。
- mysql 取每组前几条记录
daizj
mysql分组最大值最小值每组三条记录
一、对分组的记录取前N条记录:例如:取每组的前3条最大的记录 1.用子查询: SELECT * FROM tableName a WHERE 3> (SELECT COUNT(*) FROM tableName b WHERE b.id=a.id AND b.cnt>a. cnt) ORDER BY a.id,a.account DE
- HTTP深入浅出 http请求
dcj3sjt126com
http
HTTP(HyperText Transfer Protocol)是一套计算机通过网络进行通信的规则。计算机专家设计出HTTP,使HTTP客户(如Web浏览器)能够从HTTP服务器(Web服务器)请求信息和服务,HTTP目前协议的版本是1.1.HTTP是一种无状态的协议,无状态是指Web浏览器和Web服务器之间不需要建立持久的连接,这意味着当一个客户端向服务器端发出请求,然后We
- 判断MySQL记录是否存在方法比较
dcj3sjt126com
mysql
把数据写入到数据库的时,常常会碰到先要检测要插入的记录是否存在,然后决定是否要写入。
我这里总结了判断记录是否存在的常用方法:
sql语句: select count ( * ) from tablename;
然后读取count(*)的值判断记录是否存在。对于这种方法性能上有些浪费,我们只是想判断记录记录是否存在,没有必要全部都查出来。
- 对HTML XML的一点认识
e200702084
htmlxml
感谢http://www.w3school.com.cn提供的资料
HTML 文档中的每个成分都是一个节点。
节点
根据 DOM,HTML 文档中的每个成分都是一个节点。
DOM 是这样规定的:
整个文档是一个文档节点
每个 HTML 标签是一个元素节点
包含在 HTML 元素中的文本是文本节点
每一个 HTML 属性是一个属性节点
注释属于注释节点
Node 层次
- jquery分页插件
genaiwei
jqueryWeb前端分页插件
//jquery页码控件// 创建一个闭包 (function($) { // 插件的定义 $.fn.pageTool = function(options) { var totalPa
- Mybatis与Ibatis对照入门于学习
Josh_Persistence
mybatisibatis区别联系
一、为什么使用IBatis/Mybatis
对于从事 Java EE 的开发人员来说,iBatis 是一个再熟悉不过的持久层框架了,在 Hibernate、JPA 这样的一站式对象 / 关系映射(O/R Mapping)解决方案盛行之前,iBaits 基本是持久层框架的不二选择。即使在持久层框架层出不穷的今天,iBatis 凭借着易学易用、
- C中怎样合理决定使用那种整数类型?
秋风扫落叶
c数据类型
如果需要大数值(大于32767或小于32767), 使用long 型。 否则, 如果空间很重要 (如有大数组或很多结构), 使用 short 型。 除此之外, 就使用 int 型。 如果严格定义的溢出特征很重要而负值无关紧要, 或者你希望在操作二进制位和字节时避免符号扩展的问题, 请使用对应的无符号类型。 但是, 要注意在表达式中混用有符号和无符号值的情况。
&nbs
- maven问题
zhb8015
maven问题
问题1:
Eclipse 中 新建maven项目 无法添加src/main/java 问题
eclipse创建maevn web项目,在选择maven_archetype_web原型后,默认只有src/main/resources这个Source Floder。
按照maven目录结构,添加src/main/ja
- (二)androidpn-server tomcat版源码解析之--push消息处理
spjich
javaandrodipn推送
在 (一)androidpn-server tomcat版源码解析之--项目启动这篇中,已经描述了整个推送服务器的启动过程,并且把握到了消息的入口即XmppIoHandler这个类,今天我将继续往下分析下面的核心代码,主要分为3大块,链接创建,消息的发送,链接关闭。
先贴一段XmppIoHandler的部分代码
/**
* Invoked from an I/O proc
- 用js中的formData类型解决ajax提交表单时文件不能被serialize方法序列化的问题
中华好儿孙
JavaScriptAjaxWeb上传文件FormData
var formData = new FormData($("#inputFileForm")[0]);
$.ajax({
type:'post',
url:webRoot+"/electronicContractUrl/webapp/uploadfile",
data:formData,
async: false,
ca
- mybatis常用jdbcType数据类型
ysj5125094
mybatismapperjdbcType
MyBatis 通过包含的jdbcType
类型
BIT FLOAT CHAR